07.24.2026
2026 Halftime Market Insights
This video is a recording of a live webinar held July 23 by Marquette’s research team analyzing the first half…
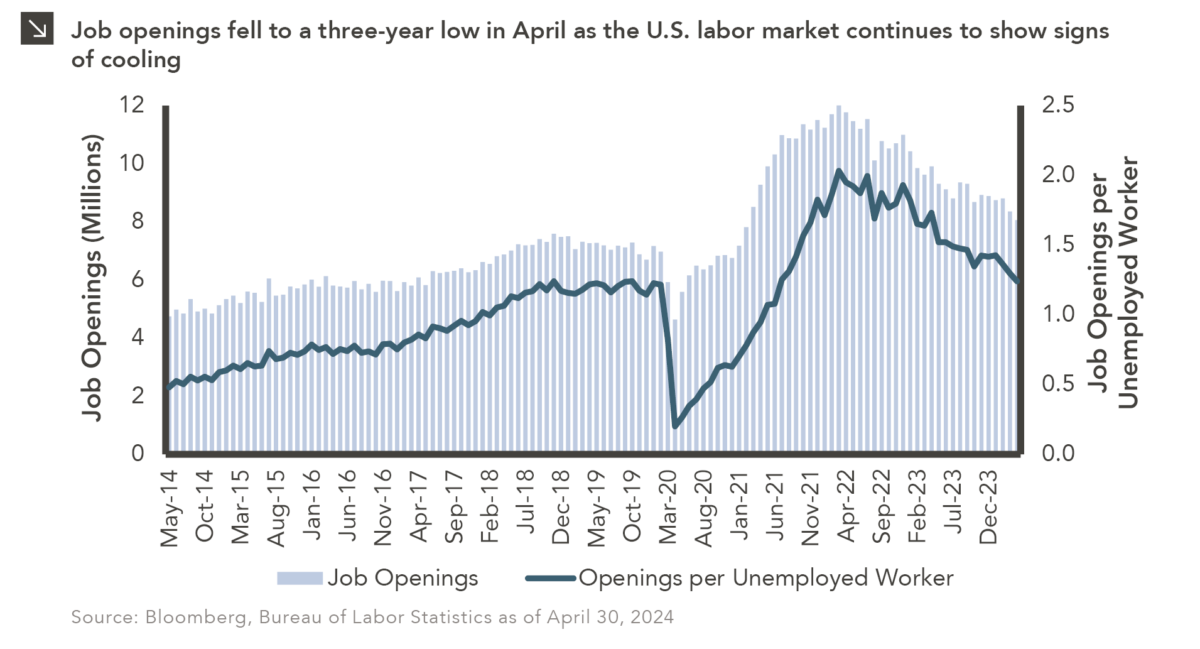
Throughout history, the state of the domestic labor market has typically served as a reliable indicator of the overall health of the U.S. economy. To that point, while the labor market has remained largely robust in the last few years, the most recent Job Openings and Labor Turnover Survey (JOLTS) from the Bureau of Labor Statistics may cause some observers to question the extent to which the employment landscape is deteriorating. Specifically, job openings in the U.S. decreased in April for the second consecutive month according to the report, falling by roughly 300,000 to just over 8 million. This figure represents the lowest level since February 2021 and equates to just over 1.2 job openings per unemployed individual (down from 1.3 in March). As can be seen in this week’s chart, April’s drop is part of a gradual decline in job openings that has been taking place for nearly two years. Interestingly, the rate at which individuals are voluntarily leaving jobs remains at a multi-year low, which could indicate a lack of confidence among labor market participants regarding the prospects of finding more attractive employment elsewhere. Not all of the April JOLTS data was negative, however, as the report stated that layoffs were unchanged on a month-over-month basis and remain low relative to historical averages.
Slowing job growth could indicate a weaker domestic economy, which makes the job of the Federal Reserve more challenging given its commitment to higher rates to combat elevated inflation. While the April JOLTS figures will likely not lead to a rate cut at next week’s FOMC meeting, further softening in the labor market could lead the central bank to weigh the employment picture more heavily when making policy decisions. Marquette will continue to monitor the impact of inflation and labor market dynamics on Fed policy and provide updates to clients accordingly.
Print PDFThe opinions expressed herein are those of Marquette Associates, Inc. (“Marquette”), and are subject to change without notice. This material is not financial advice or an offer to purchase or sell any product. Marquette reserves the right to modify its current investment strategies and techniques based on changing market dynamics or client needs.

07.24.2026
This video is a recording of a live webinar held July 23 by Marquette’s research team analyzing the first half…
07.22.2026
The usual midyear version of these letters has touched on year-to-date performance as well as the most influential macroeconomic and…

07.20.2026
Our most recent Chart of the Week publication discussed how the AI investment opportunity has expanded beyond…

07.13.2026
One of the enduring lessons of the California Gold Rush is that the greatest fortunes were often made not by…

07.06.2026
Since traditional exit routes have remained constrained in recent years due to higher interest rates, valuation gaps, and a subdued…

06.29.2026
This week’s chart highlights the varying return profiles across key infrastructure sectors by illustrating the split between income and capital…
Research alerts keep you updated on our latest research publications. Simply enter your contact information, choose the research alerts you would like to receive and click Subscribe. Alerts will be sent as research is published.
We respect your privacy. We will never share or sell your information.
If you have questions or need further information, please contact us directly and we will respond to your inquiry within 24 hours.
Contact Us >