Evan Frazier, CFA, CAIA
Senior Research Analyst
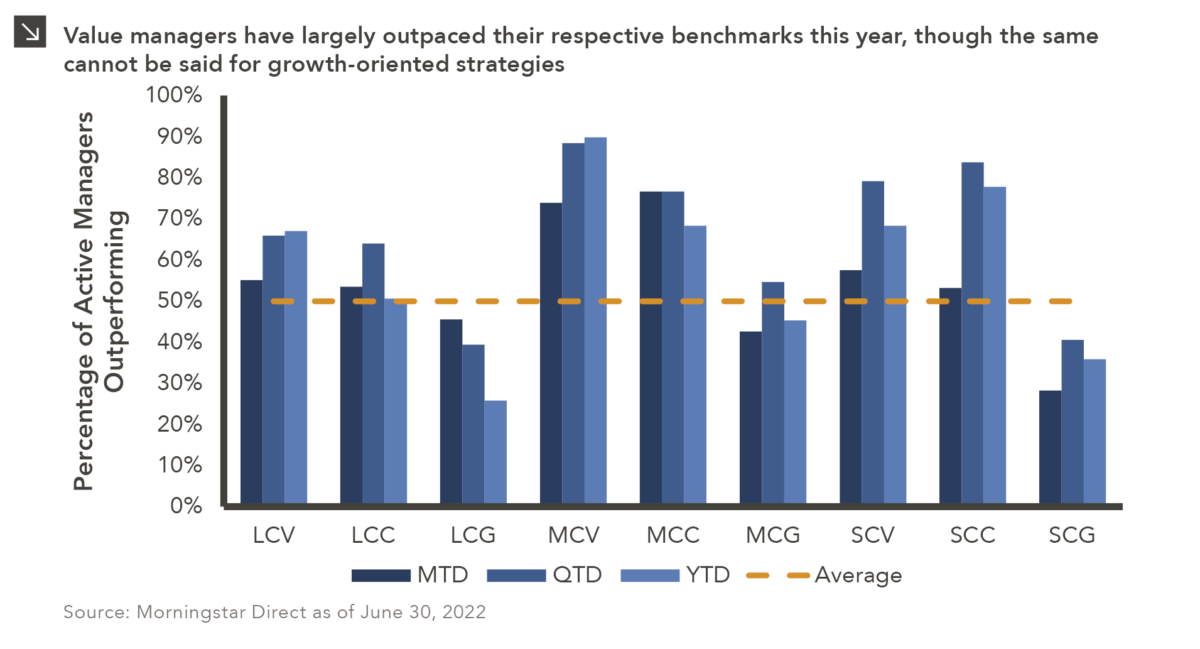
Domestic equity indices suffered significant pullbacks in the first half of 2022 amid increasing investor concerns of a prolonged economic slowdown. Growth benchmarks were hit hardest given the recent focus on rising rates, although core and value indices across the market capitalization spectrum also notched negative returns during the period. These types of broad-based pullbacks are often conducive to active manager outperformance because, in theory, one of the main benefits of active strategies is protection during down markets. Fund managers are usually able to deliver on this proposition by avoiding speculative stocks with uncertain future cash flows that tend to drop precipitously amid corrections, instead gearing toward high-quality business with pricing power and robust earnings that are able to withstand market swoons. That said, the extent to which managers have been successful in notching returns in excess of their respective benchmarks this year has largely depended on investment style.
In the first six months of 2022, most value-oriented active strategies have done a good job protecting capital. Roughly 67% of managers in the large-cap value space have outperformed their relevant benchmarks, while 90% and 78% have done the same in the mid- and small-cap value spaces, respectively. Core strategies have had similar success. Just over half of large-cap core managers have recorded positive relative returns for the year, while 68% of mid-cap core and 78% of small-cap core managers have outperformed their respective benchmarks. The story is different on the growth side, however, where just 26% of active large-cap, 45% of mid-cap, and 36% of small-cap managers have been able to keep pace with or exceed relevant benchmarks. At a high level, performance of growth indices in 2022 has largely been driven by multiple compression rather than changes in earnings growth or company fundamentals, and active managers are more likely to lag in periods when valuation is the primary driver of market returns.
Marquette recommends allocating between active and passive management based on the efficiency of the underlying market. At the top of the market capitalization spectrum, outperformance has been notoriously difficult in recent history, with roughly two-thirds of all active U.S. large-cap managers trailing the S&P 500 on a trailing 10-year basis regardless of investment style. Mid- and small-cap strategies have had more success generating alpha over longer periods of time given the less efficient nature of those segments of the market, with the majority of managers outperforming their respective indices over the last decade. While even the most capable managers experience periods of underperformance, the case for active management within the U.S. equity space is certainly stronger further down the cap spectrum. Marquette will continue to source best-in-class strategies across all asset classes and recommend these strategies for inclusion in client portfolios where appropriate.
Print PDF > Active Managers: The Mid-Year Report Card

The opinions expressed herein are those of Marquette Associates, Inc. (“Marquette”), and are subject to change without notice. This material is not financial advice or an offer to purchase or sell any product. Marquette reserves the right to modify its current investment strategies and techniques based on changing market dynamics or client needs.

07.24.2026
This video is a recording of a live webinar held July 23 by Marquette’s research team analyzing the first half…
07.22.2026
The usual midyear version of these letters has touched on year-to-date performance as well as the most influential macroeconomic and…

07.20.2026
Our most recent Chart of the Week publication discussed how the AI investment opportunity has expanded beyond…

07.13.2026
One of the enduring lessons of the California Gold Rush is that the greatest fortunes were often made not by…

07.06.2026
Since traditional exit routes have remained constrained in recent years due to higher interest rates, valuation gaps, and a subdued…

06.29.2026
This week’s chart highlights the varying return profiles across key infrastructure sectors by illustrating the split between income and capital…
Research alerts keep you updated on our latest research publications. Simply enter your contact information, choose the research alerts you would like to receive and click Subscribe. Alerts will be sent as research is published.
We respect your privacy. We will never share or sell your information.
If you have questions or need further information, please contact us directly and we will respond to your inquiry within 24 hours.
Contact Us >