Bank Failures: Past and Present

March 15, 2023 | Eddie Arrieta, Research Associate

This chart description is for illustrative purposes only and its accuracy cannot be guaranteed. Please see full disclosures at end of PDF document in the web post. General description: Three-line chart showing bank failures and associated assets and deposits since 2001. Chart subtitle: While bank failures have been rare since the Global Financial Crisis, 2023 has already seen the shuttering of two large entities. Chart source: Federal Deposit Insurance Corporation, data as of March 15, 2023. Chart visual description: Left y-axis is labeled “($M)” and ranges from $0 to $400,000. X-axis in annual increments, from 2001 to 2023. Right y-axis is labeled “Bank Failures” and ranges from 0 to 180. Orange line plots Total Assets (L), dark orange line plots Total Deposits (L), and blue line plots Number of Bank Failures (R). Chart data description: Minimal data for all three lines up to 2008. Total Assets and Deposits lines peaked in 2008 at $373B and $234B, respectively, and decreased to near zero by 2012. Bank Failures line peaked in 2010 at 157, but in 2008 there were 25, 2009 there were 140, and after peaking took until 2015 to return to single digits. 2021 and 2022 had zero failures, and 2023 is currently at 2 failures with $319B in assets and $264 in deposits. End chart description. See disclosures at end of document.

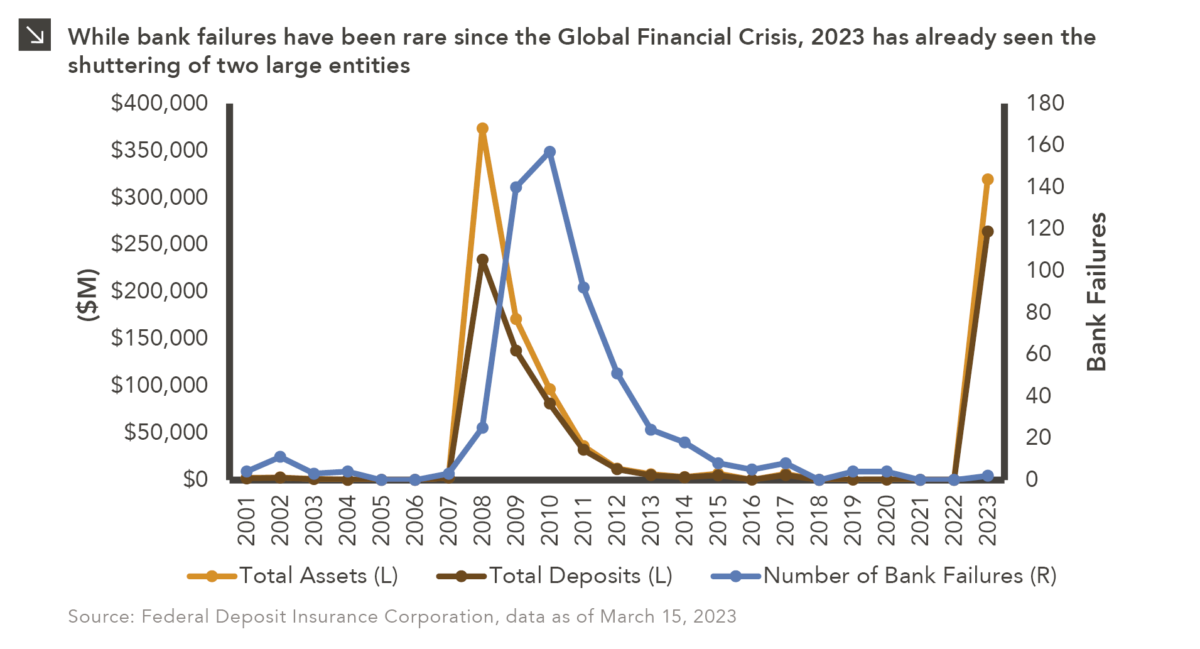
Recent developments within the banking industry have revived difficult memories of the Global Financial Crisis (GFC). As many will recall, hundreds of financial institutions failed during that period, including Washington Mutual (WaMu), a savings and loan organization with approximately $307 billion in assets at the time of its collapse. The Federal Deposit Insurance Corporation (FDIC) ultimately sold the banking subsidiaries of WaMu to JP Morgan for $1.9 billion, marking the largest U.S. bank failure in history. In total, 25 banks with combined assets of more than $373 billion closed their doors in 2008, with additional failures in 2009 (140 banks) and 2010 (157 banks). In response to the widespread impact of the GFC, the federal government enacted many new laws and regulations pertaining to the financial sector, which resulted in greater industry oversight and more robust stress tests of bank operations. While additional failures have occurred since the GFC, most banks have been healthy and resilient in the last decade, including during the COVID-19 pandemic. All told, a total of just eight banks with a combined $678 million in assets failed from 2018–2022.

Needless to say, dynamics within the domestic banking industry have shifted in the last several days. After a run on its deposits, Silicon Valley Bank, which had once been the 16th largest bank in the United States, failed and was placed into receivership of the FDIC on March 10. Silicon Valley Bank is now the second-largest bank to fail in American history, with approximately $209 billion in total assets and $175 billion in deposits at the time of its collapse. Signature Bank was the next domino to fall over the weekend, again due in part to a run on its deposits, and now stands as the third-largest U.S. bank failure ever ($110 billion in assets and $88.6 billion in deposits). While these two cases represent the only bank failures thus far in 2023, many regional banks have seen their share prices drop significantly amid fears of contagion.

It is important to remember that while GFC-inspired regulations were designed specifically to mitigate the fallout from these types of events, the situation related to recent bank failures is fluid and could have ongoing impacts on global markets and central bank interest rate policy. Marquette will continue to monitor dynamics within the banking industry and provide updates and counsel to clients accordingly.

Print PDF > Bank Failures: Past and Present


The opinions expressed herein are those of Marquette Associates, Inc. (“Marquette”), and are subject to change without notice. This material is not financial advice or an offer to purchase or sell any product. Marquette reserves the right to modify its current investment strategies and techniques based on changing market dynamics or client needs.

Eddie Arrieta
Research Associate

Get to Know Eddie

Related Content

This chart description is for illustrative purposes only and its accuracy cannot be guaranteed. Please see full disclosures at end of PDF document in the web post. General description: Combination column and line chart comparing recent holiday spending by U.S. consumers. Chart subtitle: Spending is on track to reach record levels this holiday season, despite mounting economic pressures faced by American consumers. Chart source: Adobe Analytics and CNN Business as of October 31, 2023. Chart description: Left Y-axis is labeled “Spending” and ranges from $0B to $250B. Right Y-axis is labeled “YoY Growth” and ranges from 0% to 50%. X-axis labels each column: 2019, 2020, 2021, 2022, and 2023 (Projected). Holiday Spending by U.S. Consumers is plotted in dark teal columns. Holiday Spending Growth is plotted with light purple line and markers. 2019 saw $143B in spending and 13.1% YoY growth; 2020 $188B, 32.1%; 2021 $205B, 8.7%; 2022 $212B, 3.5%, and 2023 is projected at $222B and 4.8%. End chart description. See disclosures at end of document.

11.30.2023

‘Tis the Season to Spend!

The holiday spending frenzy is well underway as some of the biggest shopping days of the year, including Black Friday…

11.16.2023

The Taming of the VIX

October proved tumultuous for investors as all major U.S. equity indices were negative and the CBOE VIX Index, which serves…

This chart description is for illustrative purposes only and its accuracy cannot be guaranteed. Please see full disclosures at end of PDF document in the web post. General description: Combination stacked column and line chart comparing unrealized gains/losses with effective federal funds rate. Chart subtitle: Unrealized losses across depository institutions have increased in recent quarters thanks to higher interest rates. Chart source: Federal Deposit Insurance Corporation and Federal Reserve Bank of St. Louis as of June 30, 2023. Chart description: Left Y-axis is labeled “Unrealized Gains/Losses” and ranges from -$800B to +$800B, corresponding to stacked columns. Right Y-axis is labeled “Rate” and ranges from -6% to +6%, corresponding to line. X-axis ranges from 1Q08 to 2Q23; labels are at 3-quarter increments to fit so last label is for 1Q23. Available-For-Sale Securities are plotted in dark green base of stacked columns; Held-To-Maturity Securities are plotted in lighter green as second half of column. Effect Federal Funds Rate line is plotted in light blue. Unrealized losses are at significant levels for chart losses; since the fed funds rate has increased since 1Q22, losses have totaled over $300B. Most recent datapoints, as of 2Q23 are as follows: Available-For-Sale Securities at -$248.9B, Held-To-Maturity Securities at -$309.6B, and Effective Federal Funds Rate at 5.3%. Please contact us for the full dataset. End chart description. See disclosures at end of document.

11.08.2023

Realizing the Impact of Unrealized Losses

Earlier this year, the regional banking crisis and eventual collapses of Silicon Valley Bank, Signature Bank, First Republic Bank, and…

This chart description is for illustrative purposes only and its accuracy cannot be guaranteed. Please see full disclosures at end of PDF document in the web post. General description: Three-line chart showing cumulative return for various U.S. equity indices. Chart subtitle: Domestic stock indices enter correction territory after recent slide. Chart source: Bloomberg as of October 31, 2023. Chart description: Y-axis is labeled “Cumulative Return” and ranges from -15% to +10%. X-axis is labeled in monthly increments, from Jun-23 to Oct-23. Data ranges 6/30/23 through 10/31/23. S&P 500 Index is plotted in orange line, Nasdaq-100 Index in light tan line, and Russell 2000 Index in dark purple line. Most recent data points, respectively, -5.31%, -4.84%, -11.61%. Please contact us for the full dataset. End chart description. See disclosures at end of document.

11.01.2023

The Chart for Red October

U.S. equities declined for the third consecutive month in October amid an environment of higher yields and underwhelming earnings reports…

10.13.2023

3Q 2023 Market Insights Video

This video is a recording of a live webinar held on October 26 by Marquette’s research team, featuring in-depth analysis…

10.26.2023

Portfolio Trick or Treat

Coming into 2023, investors were cautiously optimistic about 2023 market returns; cautious considering the broad losses across asset classes during…

More articles

Subscribe to Research Email Alerts

Research Email Alert Subscription

Research alerts keep you updated on our latest research publications. Simply enter your contact information, choose the research alerts you would like to receive and click Subscribe. Alerts will be sent as research is published.

We respect your privacy. We will never share or sell your information.

Thank You

We appreciate your interest in Marquette Associates.

If you have questions or need further information, please contact us directly and we will respond to your inquiry within 24 hours.

Contact Us >