David Hernandez, CFA
Director of Traditional Manager Search


Political instability increased dramatically in 2018 and the Brexit looms as a major contributor to the uncertainty in 2019. The UK is scheduled to leave the European Union (EU) on March 29th, 2019 however there is no current plan in place for the exit. On Tuesday, January 15th, the UK government resoundingly rejected Prime Minister May’s Brexit plan, 432 votes to 202. May had negotiated this agreement with the EU in an attempt to organize an orderly departure.
On Wednesday January 16th, a day after her plan’s defeat, Prime Minister May survived a vote of no confidence, 325 votes to 306. With her leadership role intact, May must develop an exit plan that the UK leadership will pass, and the EU will approve. This must be done with the clock ticking and as we move closer to March 29th, the possibility of a “no deal” Brexit increases. This is an outcome neither the UK nor the EU want, and if this occurs, volatility in equity markets is likely to spike. To avoid this, we may see a vote to delay the exit and should the UK fail to reach an agreement perhaps we may see a second referendum. Ultimately, as is usually the case with these types of issues, markets will welcome any resolution that clears up the uncertainty surrounding the event.
The opinions expressed herein are those of Marquette Associates, Inc. (“Marquette”), and are subject to change without notice. This material is not financial advice or an offer to purchase or sell any product. Marquette reserves the right to modify its current investment strategies and techniques based on changing market dynamics or client needs.

The opinions expressed herein are those of Marquette Associates, Inc. (“Marquette”), and are subject to change without notice. This material is not financial advice or an offer to purchase or sell any product. Marquette reserves the right to modify its current investment strategies and techniques based on changing market dynamics or client needs.
11.09.2026
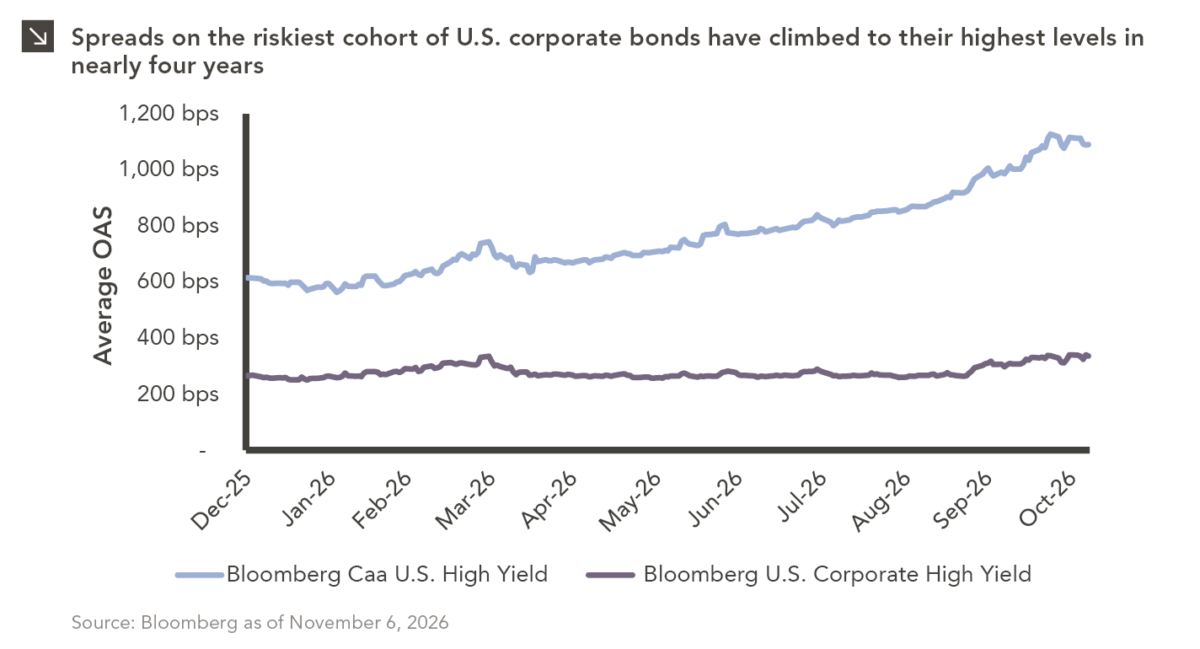
The U.S. distressed debt market is showing increasingly pronounced signs of stress. As of this writing, option-adjusted spreads on CCC-rated…
11.02.2026
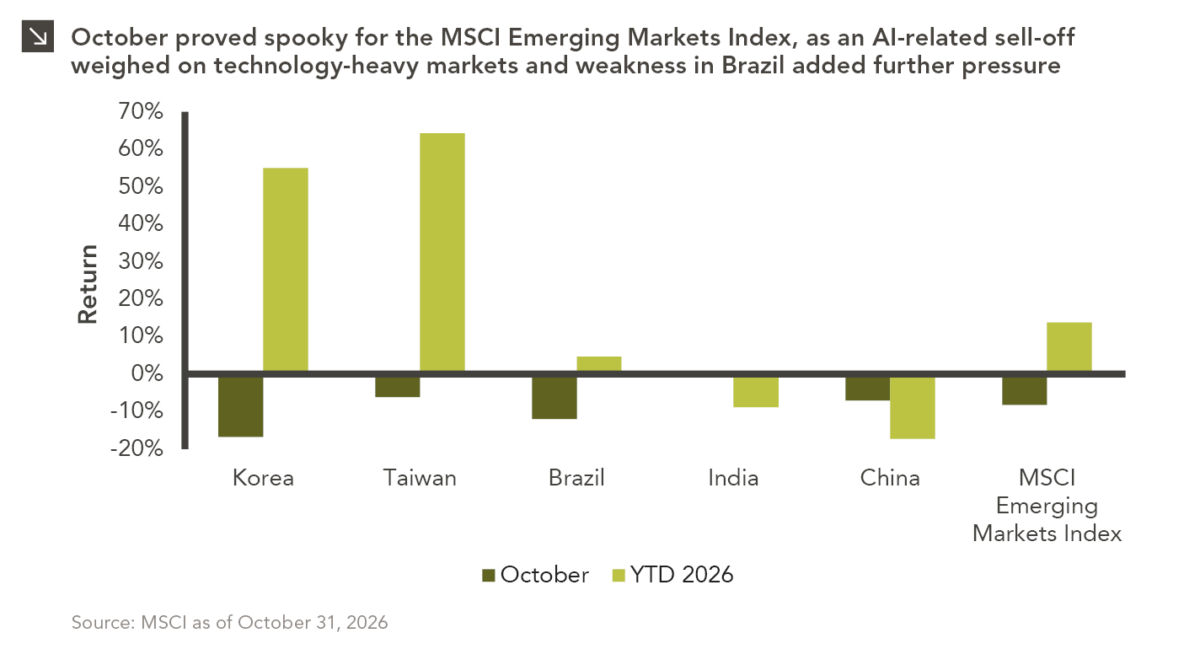
Emerging markets faced a challenging October, with the space declining by around 8.3% amid renewed concerns over the sustainability of…
10.26.2026
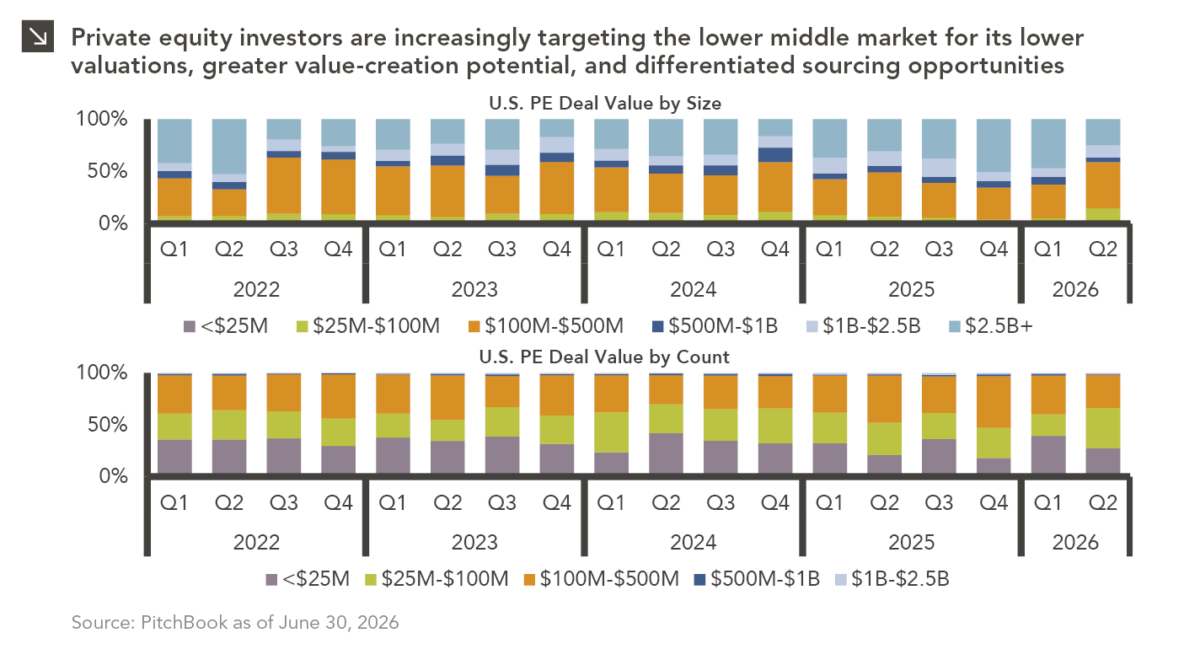
Private equity activity is increasingly shifting toward smaller transactions, with total deal value for transactions of $100 million or less…

10.08.2026
This video is a recording of a live webinar held October 22 by Marquette’s research team analyzing the third quarter…

10.22.2026
Anyone who has run a marathon knows the last six miles are brutal — no matter how well the first…
10.19.2026
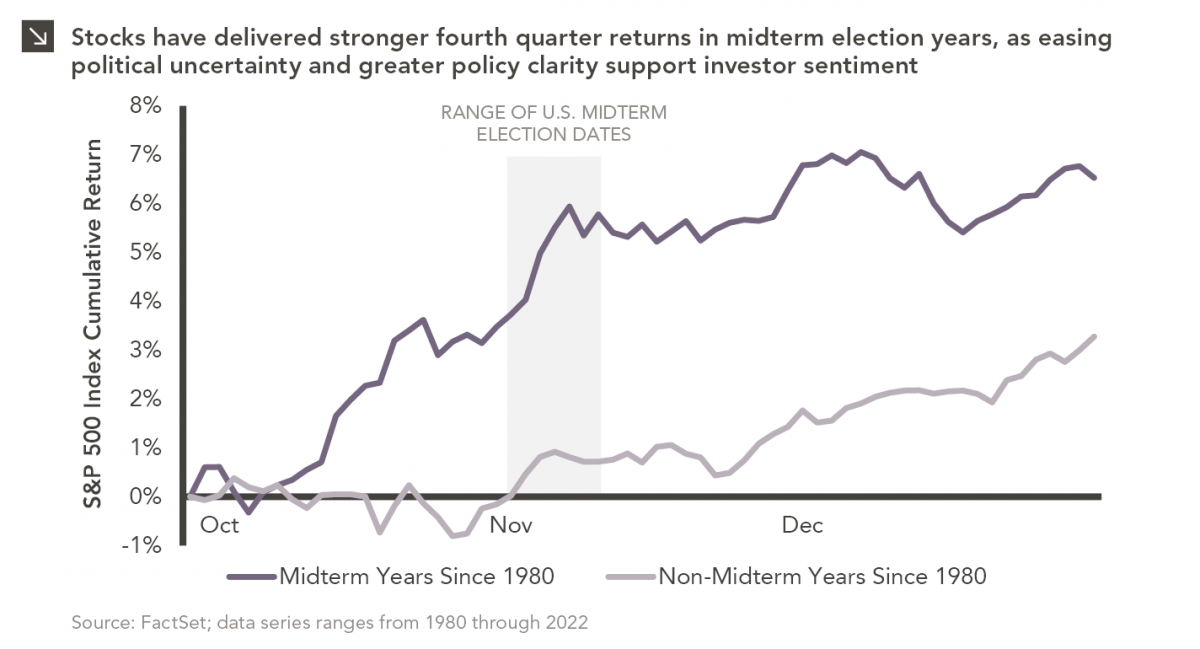
Since 1980, the S&P 500 Index has generally performed well in the weeks surrounding U.S. midterm elections. Specifically, the index…
Research alerts keep you updated on our latest research publications. Simply enter your contact information, choose the research alerts you would like to receive and click Subscribe. Alerts will be sent as research is published.
We respect your privacy. We will never share or sell your information.
If you have questions or need further information, please contact us directly and we will respond to your inquiry within 24 hours.
Contact Us >