Eddie Arrieta
Associate Research Analyst
Get to Know Eddie


Argentina has faced myriad economic headwinds in recent time, including hyperinflation, currency-related difficulties, and a series of defaults on its sovereign debt. As the country headed into a presidential election year in 2023, Javier Milei, a member of the Argentinian Libertarian Party, emerged as a front-runner in the race, as many viewed his laissez-faire approach to economic policy as having the potential to correct the nation’s trajectory. Milei ultimately won the presidential election and assumed office in December of last year.
Over the last several months, President Milei has enacted a series of unique and controversial economic policies aimed at making the nation’s currency more competitive, reigning in excessive inflation, and stabilizing Argentina’s economic footing. These policies include the devaluation of the Argentinian peso by more than 50% and the introduction of a crawling peg, which is designed to further depreciate the peso. Additional initiatives by the Milei government include lifting capital controls, slashing state subsidies, and scrapping hundreds of government jobs and regulations. This austerity program, while certainly creating its own set of complications for the Argentinian people, has been largely well received by investors. To that point, the MSCI Argentina Index has returned close to 200% on a cumulative basis over the last two years, which is far in excess of the cumulative returns of both the MSCI Emerging Markets and MSCI Frontier Emerging Markets indices in that time. This performance is a sign of investor optimism related to the country’s economic prospects under Milei’s leadership, and Argentina’s status as a world leader in lithium and copper reserves could provide additional support from market participants. Marquette will continue to monitor the progress made by Argentina on the economic front.
Print PDF
The opinions expressed herein are those of Marquette Associates, Inc. (“Marquette”), and are subject to change without notice. This material is not financial advice or an offer to purchase or sell any product. Marquette reserves the right to modify its current investment strategies and techniques based on changing market dynamics or client needs.
11.02.2026
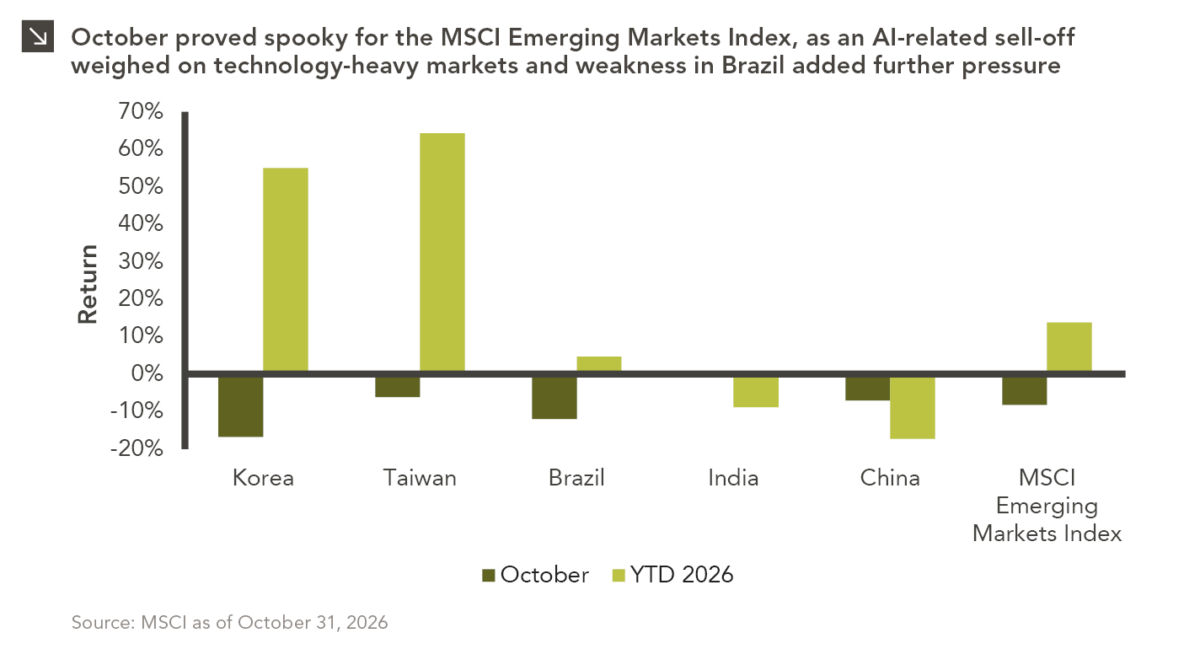
Emerging markets faced a challenging October, with the space declining by around 8.3% amid renewed concerns over the sustainability of…
10.26.2026
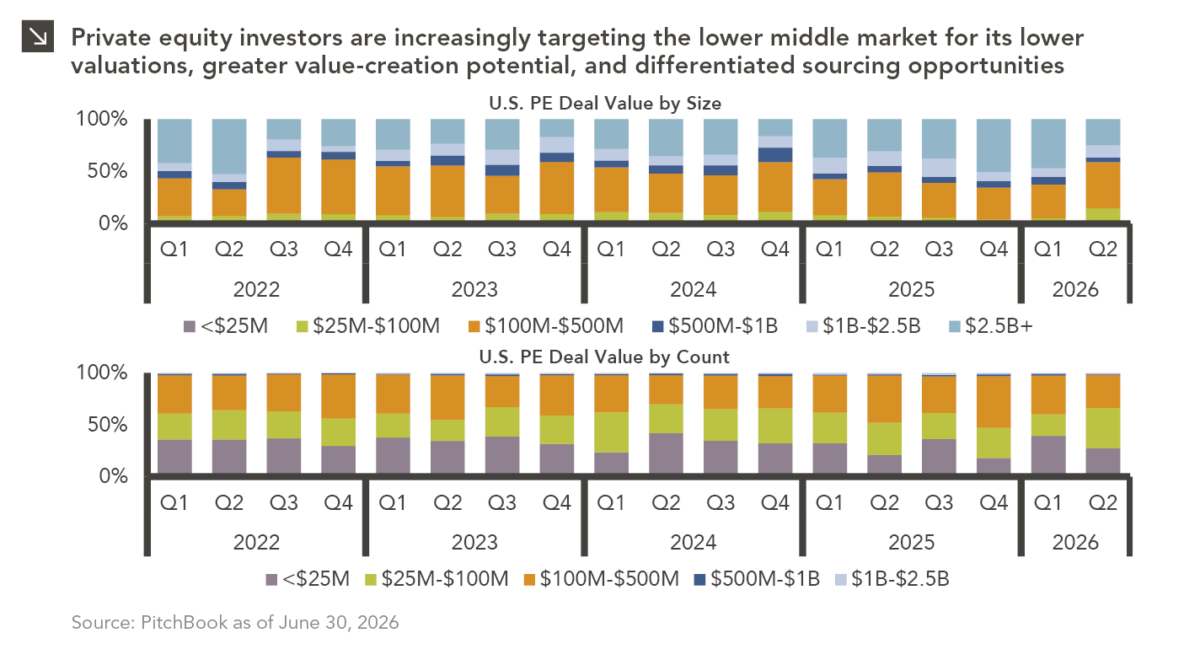
Private equity activity is increasingly shifting toward smaller transactions, with total deal value for transactions of $100 million or less…

10.08.2026
This video is a recording of a live webinar held October 22 by Marquette’s research team analyzing the third quarter…

10.22.2026
Anyone who has run a marathon knows the last six miles are brutal — no matter how well the first…
10.19.2026
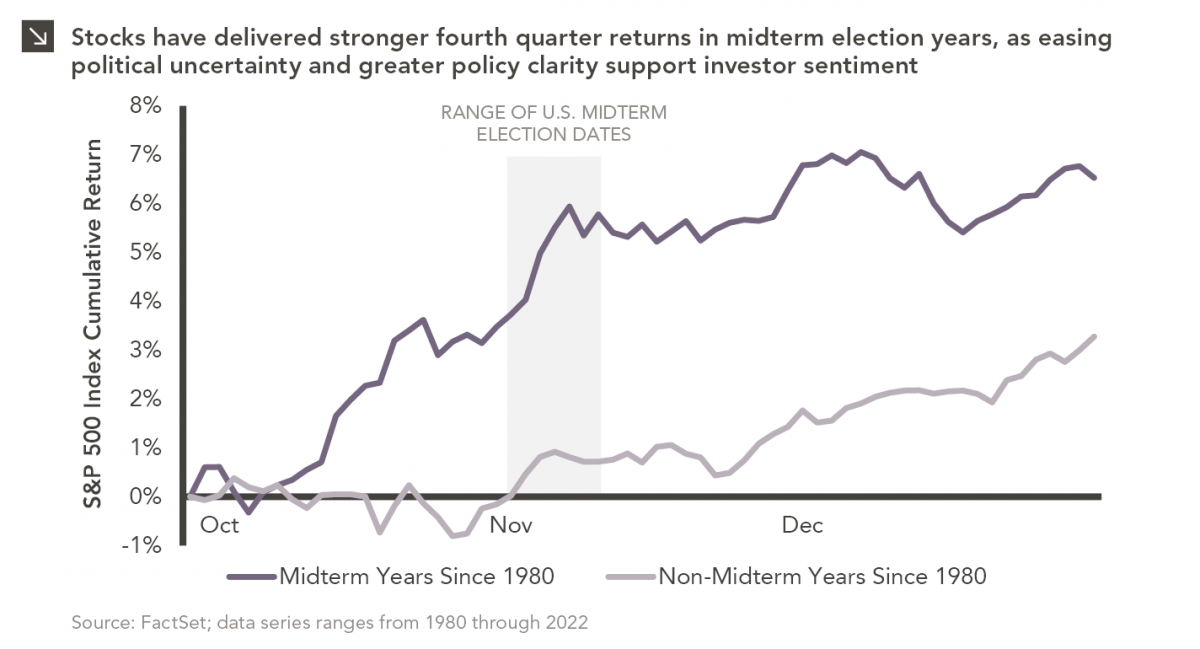
Since 1980, the S&P 500 Index has generally performed well in the weeks surrounding U.S. midterm elections. Specifically, the index…
10.12.2026
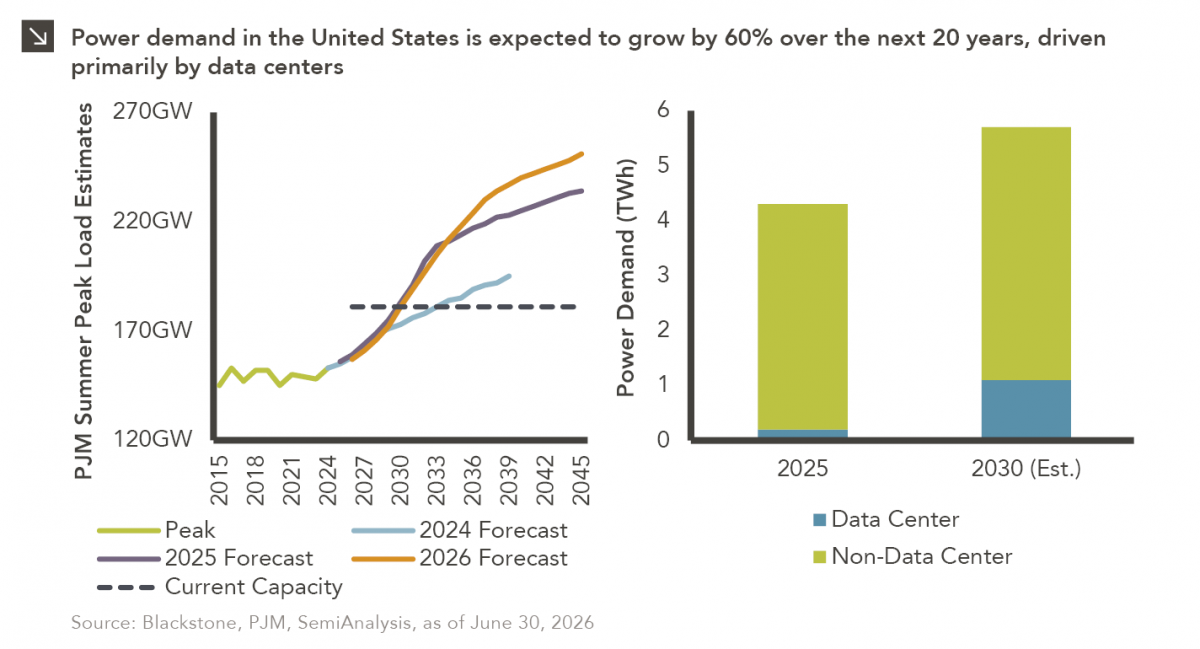
This week’s chart highlights the accelerating growth of electricity demand in the U.S., which has been driven primarily by the…
Research alerts keep you updated on our latest research publications. Simply enter your contact information, choose the research alerts you would like to receive and click Subscribe. Alerts will be sent as research is published.
We respect your privacy. We will never share or sell your information.
If you have questions or need further information, please contact us directly and we will respond to your inquiry within 24 hours.
Contact Us >