Catherine Hillier
Senior Research Analyst
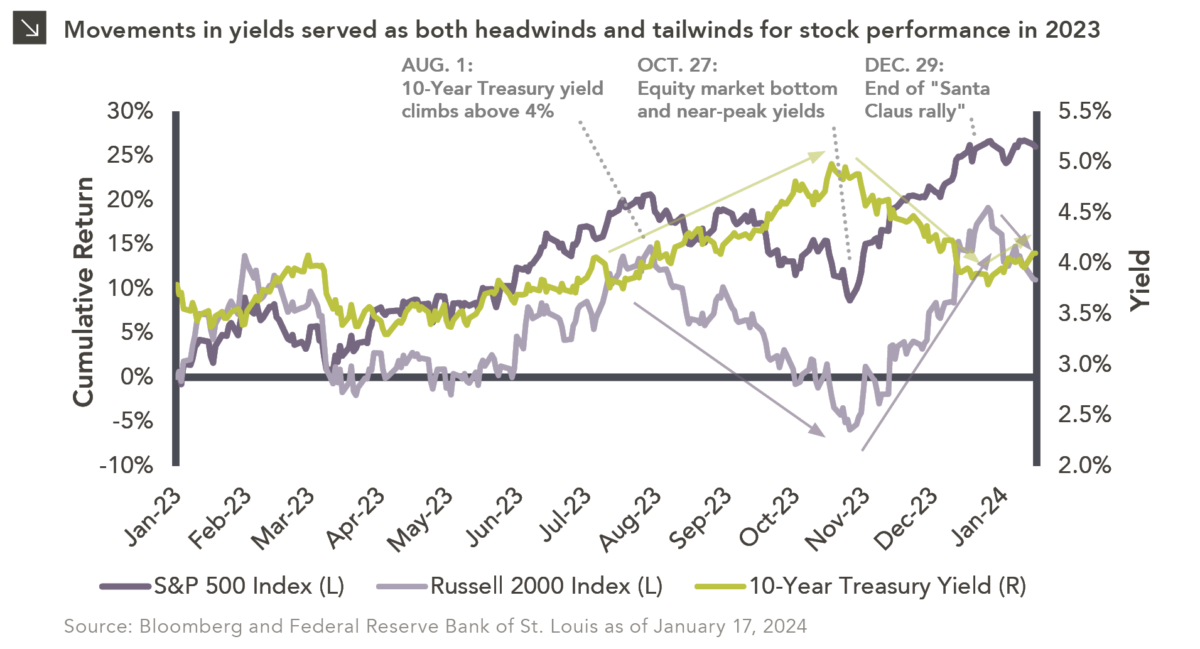
While robust equity market performance in 2023 was certainly in part spurred by the strength of mega-cap technology stocks, economic data and the movement of interest rates also played a critical role. To that point, a decline in Treasury yields to start last year helped fuel a low-quality rally in equity markets, though yields moderated over the next few months following the regional banking chaos that unfolded in February and March. Dynamics shifted in July, however, when yields began to surge as the U.S. Treasury announced new debt issuance to help fund a growing budget deficit. As the year progressed, the continued strength of the domestic economy, including a robust labor market and a resilient consumer, combined with hawkish Fed rhetoric caused yields to climb even further. The 10-Year Treasury yield notably rose to nearly 5% by mid-October, its highest level in over 15 years. Equity markets largely sold off in tandem with this spike in yields, with the Russell 2000 Index reaching an intra-year low on October 27, 2023. Market dynamics once again shifted in the final weeks of 2023, as cooling inflation data led to a more dovish tone from the Fed and widespread investor anticipation of near-term interest rate cuts. This changing sentiment supported a reversal in the 10-Year Treasury yield in late October. As a result of renewed optimism, equity markets exhibited a sustained rally to close the year, with the S&P 500 Index approaching all-time highs in late December. Small-cap equities, which were shunned by investors for much of 2023 amid an environment of higher rates, climbed nearly 25% from their October lows through year-end. Though this rally saw the reemergence of market breadth, as both cyclicals and growth-oriented equities notched strong returns, actively managed strategies struggled due to the outperformance of lower-quality stocks.
This “Santa Claus rally” that ended last year has ultimately tapered off, with equity markets declining to start 2024 amid slightly higher yields. While this trend could foreshadow further challenges for equities in 2024, it may also be a necessary correction. Specifically, given the sharp rise in stocks to close last year, investors may have priced in an overly optimistic probability of interest rate cuts and are just now beginning to consider the possibility that the Fed will not be as accommodative as expected in 2024. This recent correction may also provide some valuation support in the event of any missteps during this quarter’s earnings season, which is slated to kick off in the coming days. As 2024 progresses, policy decisions by the Federal Reserve and the movements in Treasury yields will likely continue to impact investor sentiment and market performance.
Print PDF
The opinions expressed herein are those of Marquette Associates, Inc. (“Marquette”), and are subject to change without notice. This material is not financial advice or an offer to purchase or sell any product. Marquette reserves the right to modify its current investment strategies and techniques based on changing market dynamics or client needs.

07.27.2026
The rapid growth of non-traded business development companies (BDCs), which are investment vehicles that pool investor capital to make loans…

07.24.2026
This video is a recording of a live webinar held July 23 by Marquette’s research team analyzing the first half…
07.22.2026
The usual midyear version of these letters has touched on year-to-date performance as well as the most influential macroeconomic and…

07.20.2026
Our most recent Chart of the Week publication discussed how the AI investment opportunity has expanded beyond…

07.13.2026
One of the enduring lessons of the California Gold Rush is that the greatest fortunes were often made not by…

07.06.2026
Since traditional exit routes have remained constrained in recent years due to higher interest rates, valuation gaps, and a subdued…
Research alerts keep you updated on our latest research publications. Simply enter your contact information, choose the research alerts you would like to receive and click Subscribe. Alerts will be sent as research is published.
We respect your privacy. We will never share or sell your information.
If you have questions or need further information, please contact us directly and we will respond to your inquiry within 24 hours.
Contact Us >