Matt Anderson, CFA
Vice President, Client Service
Get to Know Matt


The United Kingdom’s vote to leave the European Union on June 23rd was an unprecedented event that impacted markets around the world. While this exit won’t actually take place for another two years, equities sold off in a knee-jerk fashion as investors feared the ramifications on the global economy. Due to the heavy exposure to Europe, non-U.S. developed markets suffered the most, losing nearly 10% before rebounding.
With the U.S. viewed as a safe haven, domestic equities have fared relatively well in the Brexit aftermath. The U.S. dollar appreciated following the decision while the British pound slumped to a 30 year low against the greenback. Emerging market (EM) currencies have also depreciated against the dollar however EM equities have been one of the stronger performers. This asset class has benefitted from the U.S. Federal Reserve indicating it will not make any significant interest rate movements due to the risk the Brexit poses to the economy. Only a few days after the UK vote, EM equities rallied for its biggest weekly gain since March. While the Brexit will undoubtedly have long-term ramifications, many of which are currently unclear, equity markets have rebounded from the initial sell-off.

The opinions expressed herein are those of Marquette Associates, Inc. (“Marquette”), and are subject to change without notice. This material is not financial advice or an offer to purchase or sell any product. Marquette reserves the right to modify its current investment strategies and techniques based on changing market dynamics or client needs.
11.02.2026
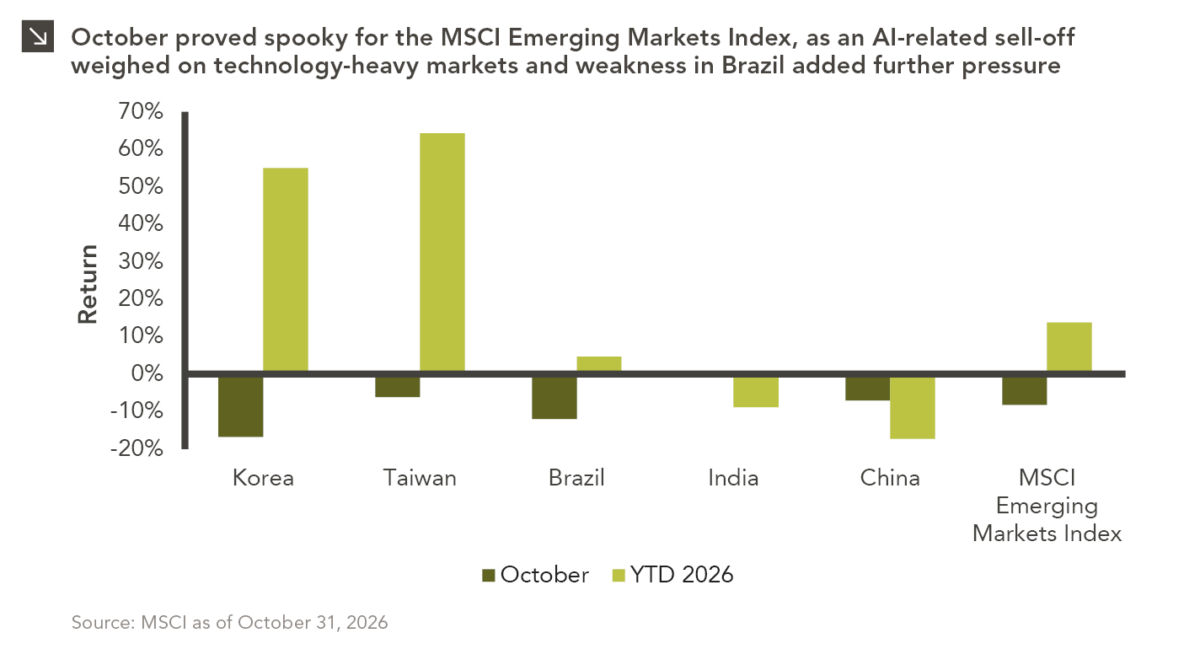
Emerging markets faced a challenging October, with the space declining by around 8.3% amid renewed concerns over the sustainability of…
10.26.2026
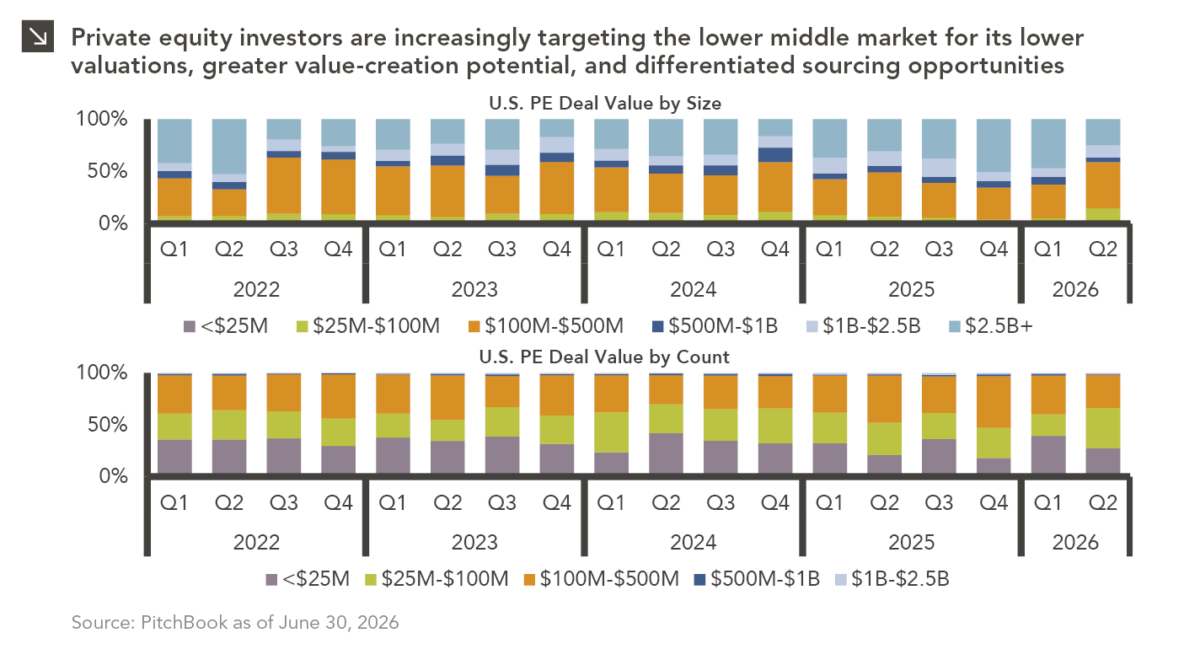
Private equity activity is increasingly shifting toward smaller transactions, with total deal value for transactions of $100 million or less…

10.08.2026
This video is a recording of a live webinar held October 22 by Marquette’s research team analyzing the third quarter…

10.22.2026
Anyone who has run a marathon knows the last six miles are brutal — no matter how well the first…
10.19.2026
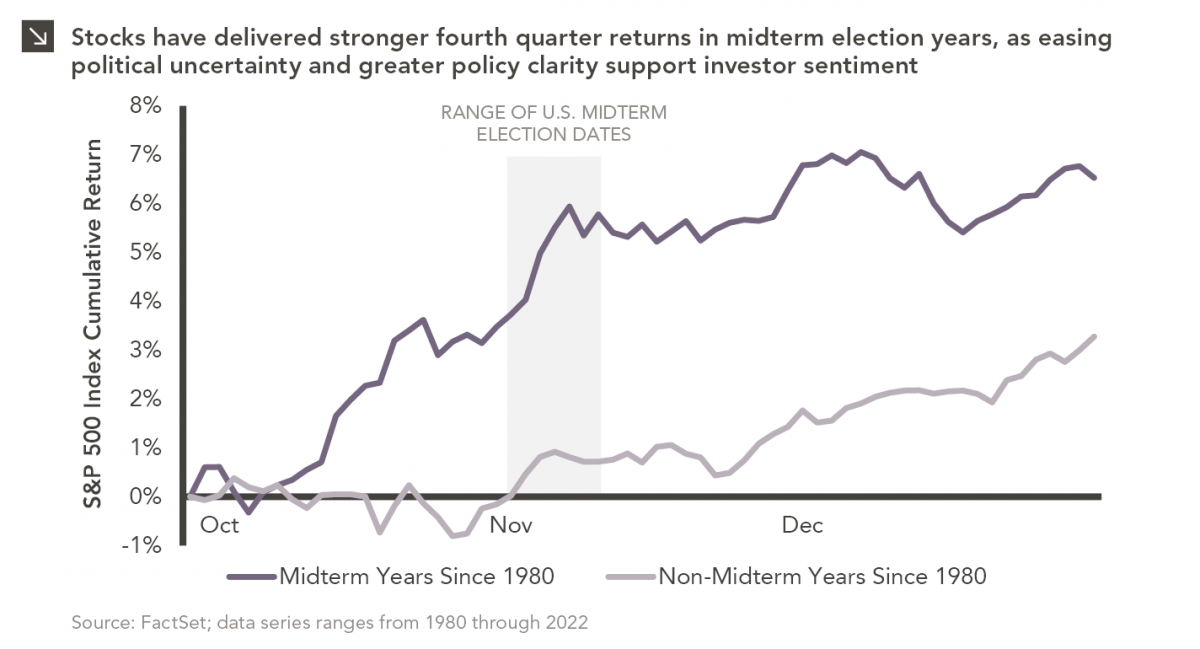
Since 1980, the S&P 500 Index has generally performed well in the weeks surrounding U.S. midterm elections. Specifically, the index…
10.12.2026
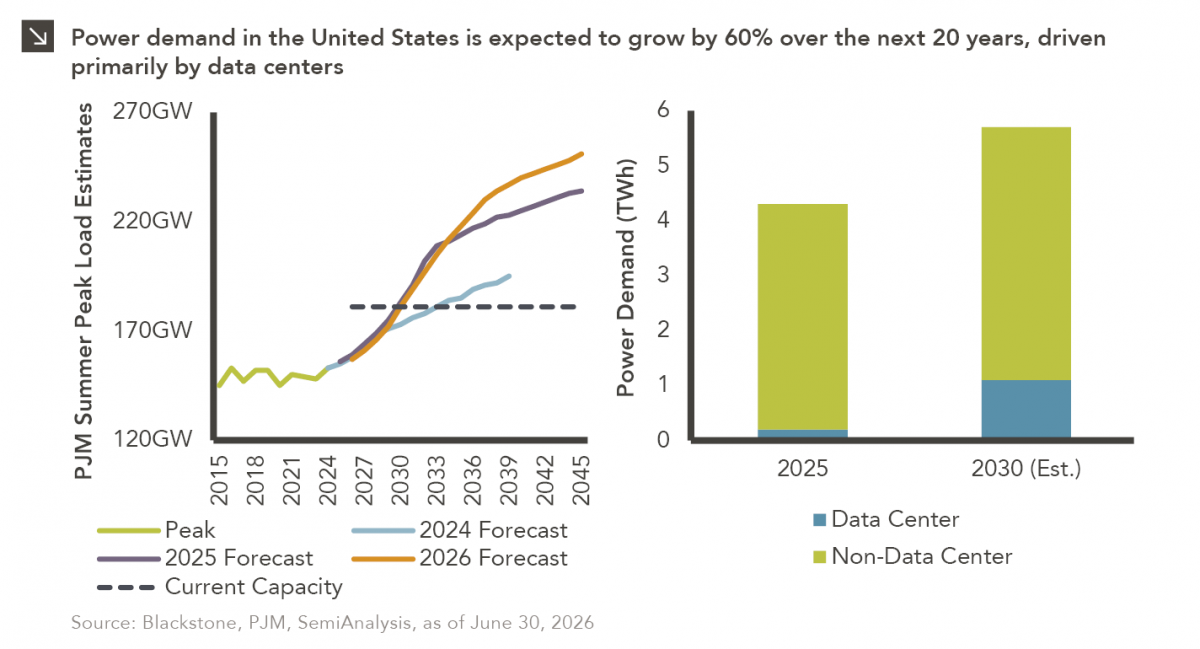
This week’s chart highlights the accelerating growth of electricity demand in the U.S., which has been driven primarily by the…
Research alerts keep you updated on our latest research publications. Simply enter your contact information, choose the research alerts you would like to receive and click Subscribe. Alerts will be sent as research is published.
We respect your privacy. We will never share or sell your information.
If you have questions or need further information, please contact us directly and we will respond to your inquiry within 24 hours.
Contact Us >