Kweku Obed, CFA, CAIA
Partner


While we cannot predict exactly when and by how much rates will rise, the Federal Reserve (“Fed”) has recently signaled that we could see a modest increase in the fed funds rate by mid-2015. Given the increased possibility of rates rising over the next few years, investors should not retreat in fear from bonds en masse or look to underweight their fixed income allocations to anemic levels. Instead, they should continue to view fixed income as strategically important: after all, fixed income is a broad asset class with a diverse opportunity set. And, while we will summarize our views on some different sub-asset classes in this paper (including floating rate bonds, non-U.S. debt and convertibles), for additional reading on non-core fixed income sub-asset classes, please refer to our previously released papers on global fixed income, emerging markets debt, high yield, and senior secured loans.
In respecting the broadness of our client base, we seek to avoid a one-size-fits-all narrative on how they could look to manage their bond allocations: some clients will be limited in their ability to access certain sub-asset classes while others will have ample room and resources to maneuver across the choice spectrum. Consequently, there are a number of prudent approaches and strategies for these different types of investors to explore as a means of hedging their interest rate risk. The key is establishing which portfolio framework or sub-asset class exposure is the best fit for their programs and in line with their circumstances, risk tolerances, and investment goals.

The opinions expressed herein are those of Marquette Associates, Inc. (“Marquette”), and are subject to change without notice. This material is not financial advice or an offer to purchase or sell any product. Marquette reserves the right to modify its current investment strategies and techniques based on changing market dynamics or client needs.
10.26.2026
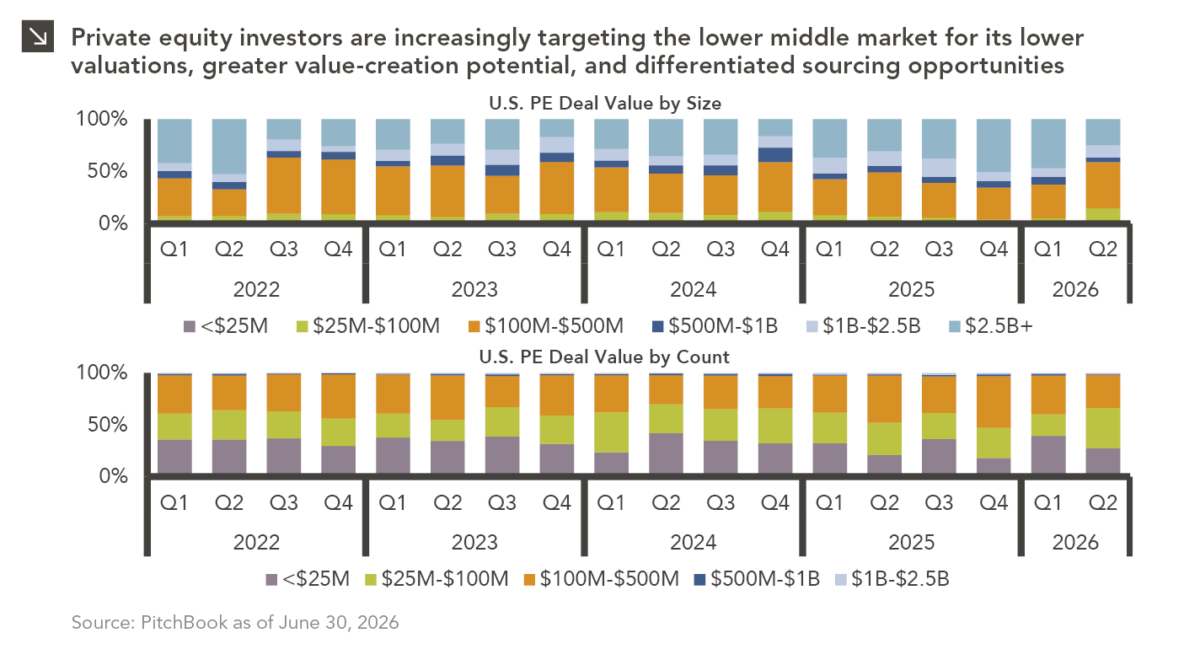
Private equity activity is increasingly shifting toward smaller transactions, with total deal value for transactions of $100 million or less…

10.08.2026
This video is a recording of a live webinar held October 22 by Marquette’s research team analyzing the third quarter…

10.22.2026
Anyone who has run a marathon knows the last six miles are brutal — no matter how well the first…
10.05.2026
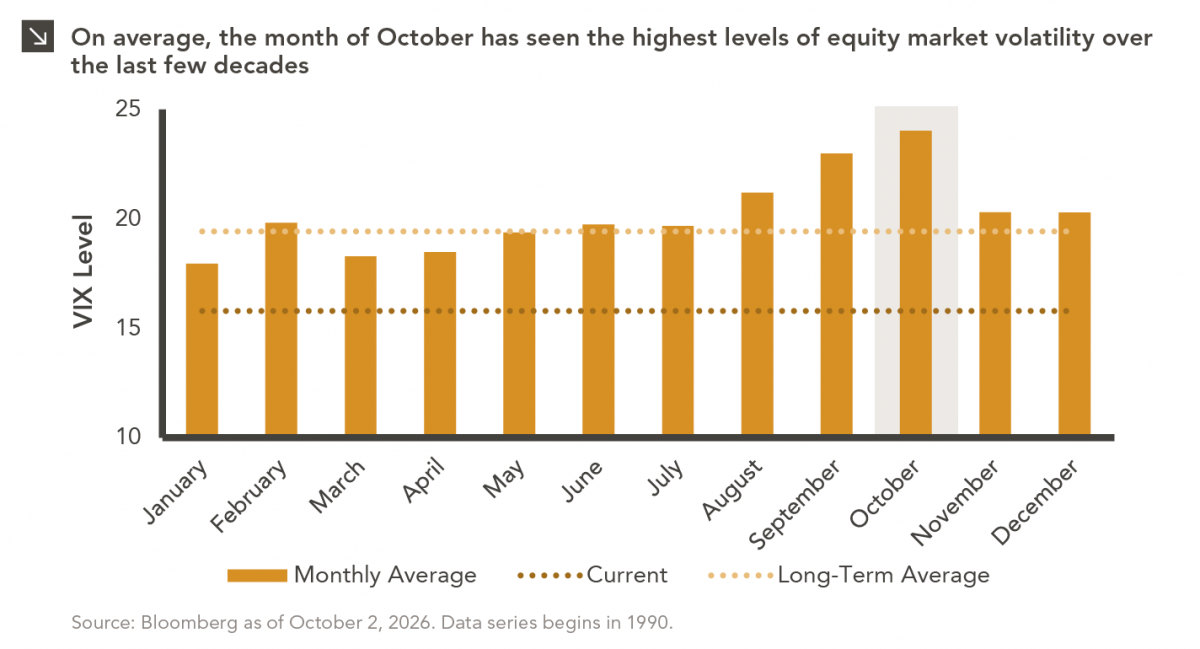
For investors, the spookiest thing about October might not be the ghosts and monsters that are bound to show up…
09.28.2026
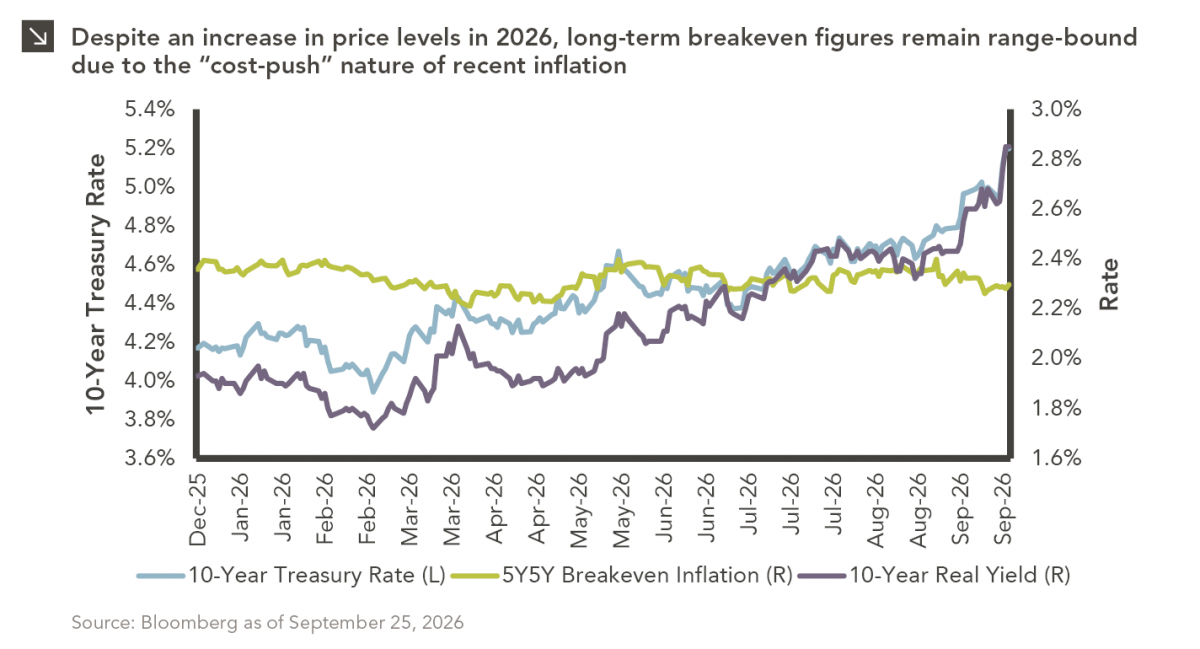
The phrase “expectations of higher inflation” has become a staple in financial news to explain the increase in nominal U.S….
09.21.2026
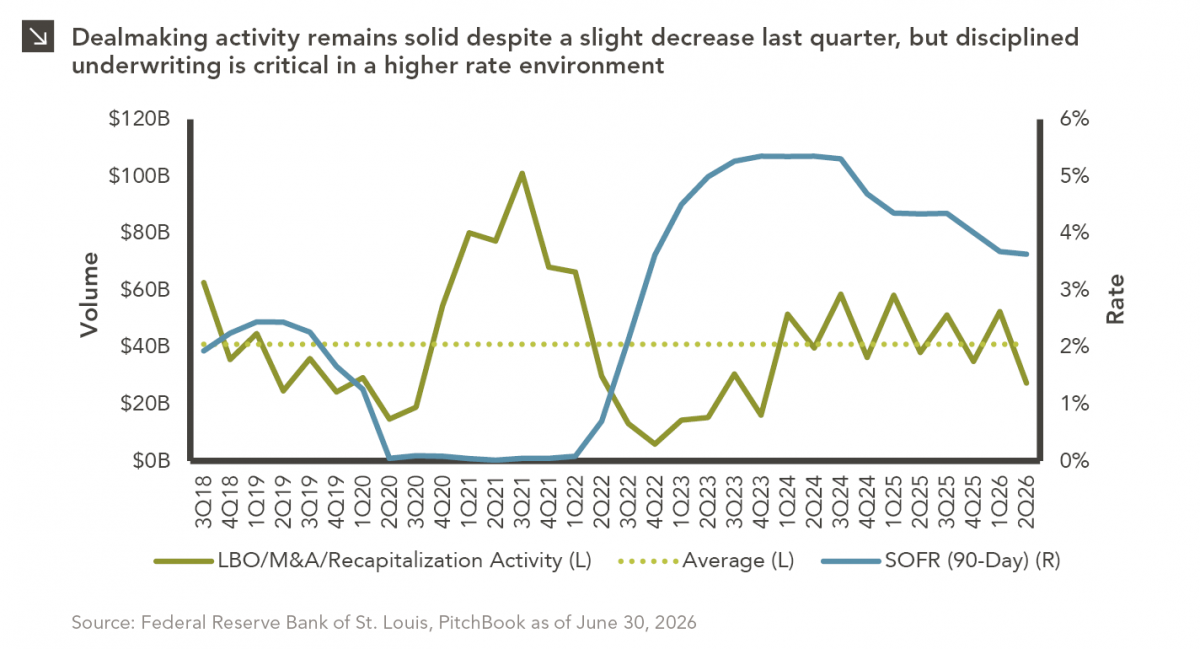
For much of the past several years, the conventional view has been that higher interest rates and stretched valuations would…
Research alerts keep you updated on our latest research publications. Simply enter your contact information, choose the research alerts you would like to receive and click Subscribe. Alerts will be sent as research is published.
We respect your privacy. We will never share or sell your information.
If you have questions or need further information, please contact us directly and we will respond to your inquiry within 24 hours.
Contact Us >