10.22.2026
Will Higher Rates Cramp the Markets?
Anyone who has run a marathon knows the last six miles are brutal — no matter how well the first…


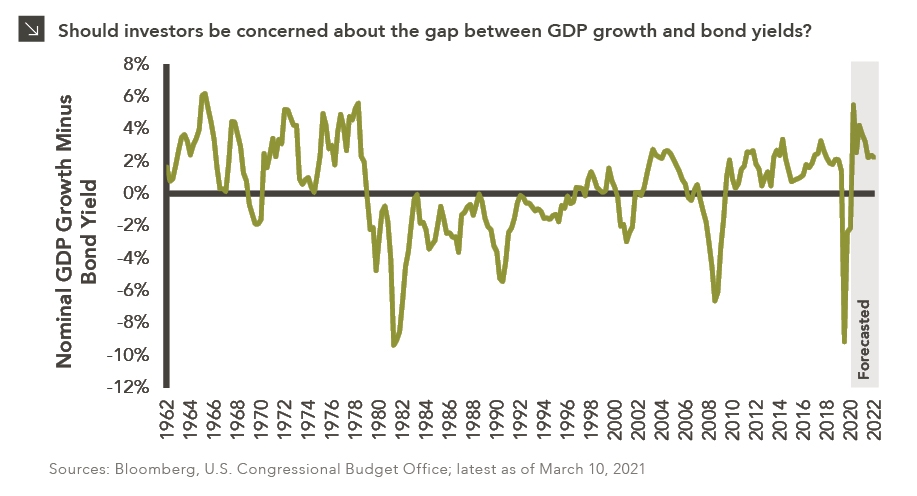
The gap between U.S. GDP growth and bond yields is expected to rise to the highest level since the 1970s amid unprecedented amounts of fiscal and monetary stimulus and an accelerating vaccination roll-out. The chart depicts nominal U.S. GDP growth rates year-over-year less the 10-year U.S. Treasury yield over the last 60 years. Beyond 2020, we profile the U.S. Congressional Budget Office (“CBO”) forecasted nominal GDP growth rate for 2021 and 2022, minus the forecasted 10-year U.S. Treasury yield from the Treasury forwards market, which projects a 25 basis point rise each year over the next four years.
The quarterly GDP growth rate is much more volatile than bond yields. It can decline precipitously in a recession much faster than bond yields as well as rebound much faster than bond yields in a recovery. The ratio has spiked down several times in the past: during the early 1980s and early 1990s recessions, following the dot-com bust of 2000 and the housing bust of 2008, and most recently after the COVID panic of March 2020. This is because the GDP growth rate reflects actual economic growth, measured year-over-year quarterly, while bond yields reflect the market’s anticipation of economic growth over a longer time period. While this gap is expected to reach its highest level in roughly 50 years as the economy rebounds from the depths of COVID, it is then expected to moderate back to pre-pandemic levels, as the CBO forecasts GDP growth to normalize throughout 2021 and 2022 after the initial recovery. Therefore, despite the spike in this ratio it is not a fundamental concern for investors and is not suggestive of a coming market downturn.
Print PDF > GDP Growth Hits Highs vs. Bond Yields
The opinions expressed herein are those of Marquette Associates, Inc. (“Marquette”), and are subject to change without notice. This material is not financial advice or an offer to purchase or sell any product. Marquette reserves the right to modify its current investment strategies and techniques based on changing market dynamics or client needs.

10.22.2026
Anyone who has run a marathon knows the last six miles are brutal — no matter how well the first…

10.19.2026
Since 1980, the S&P 500 Index has generally performed well in the weeks surrounding U.S. midterm elections. Specifically, the index…

10.12.2026
This week’s chart highlights the accelerating growth of electricity demand in the U.S., which has been driven primarily by the…

10.08.2026
LIVE WEBINAR — OCTOBER 22 Please join Marquette’s research team for our 3Q 2026 Market Insights Webinar…

10.05.2026
For investors, the spookiest thing about October might not be the ghosts and monsters that are bound to show up…

09.28.2026
The phrase “expectations of higher inflation” has become a staple in financial news to explain the increase in nominal U.S….
Research alerts keep you updated on our latest research publications. Simply enter your contact information, choose the research alerts you would like to receive and click Subscribe. Alerts will be sent as research is published.
We respect your privacy. We will never share or sell your information.
If you have questions or need further information, please contact us directly and we will respond to your inquiry within 24 hours.
Contact Us >