David Hernandez, CFA
Director of Traditional Manager Search


In an attempt to revive the long struggling Japanese economy, Prime Minister Shinzo Abe implemented his “Abenomics” strategy which included an unprecedented open-ended asset purchase program. The monetary easing policy was implemented with the goal of spurring domestic spending and increasing exports via a devalued currency. Equity investors reacted positively to the plan and the MSCI Japan Index returned 27.4% in 2013. With both corporate profits and business confidence rising, the initial results of “Abenomics” appear promising.
To keep things on course, Japanese companies will need to boost workers’ wages, a phenomenon that has rarely occurred for earners. This week’s chart shows the year-over-year change in wage earnings has been largely negative over the last 24 months. However in recent weeks during the annual wage negotiations (known as “shunto,” which translates to “spring offensive”) between unions and employers, several large companies, including Toyota, Honda, and Toshiba announced significant wage increases for the first time since 2008. Now economists will observe whether medium and small size companies follow suit. A rise in wages will help continue the initial positive momentum created by the monetary easing policies of “Abenomics” and could mean Japanese equities still have some upside left.

The opinions expressed herein are those of Marquette Associates, Inc. (“Marquette”), and are subject to change without notice. This material is not financial advice or an offer to purchase or sell any product. Marquette reserves the right to modify its current investment strategies and techniques based on changing market dynamics or client needs.
11.09.2026
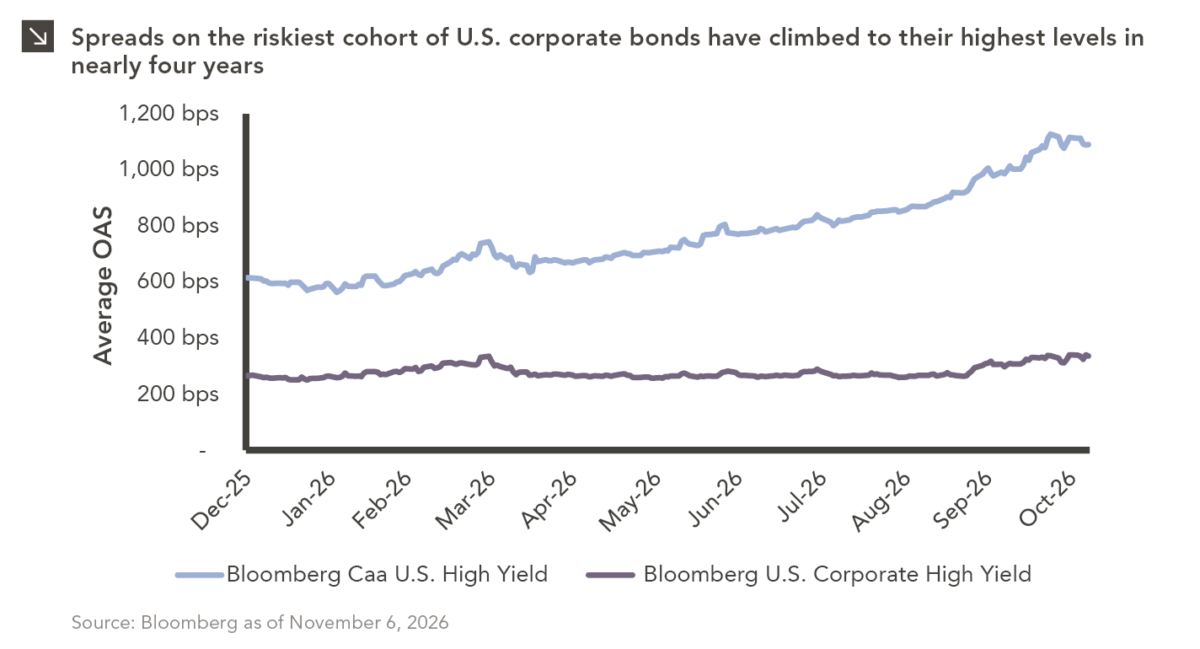
The U.S. distressed debt market is showing increasingly pronounced signs of stress. As of this writing, option-adjusted spreads on CCC-rated…
11.02.2026
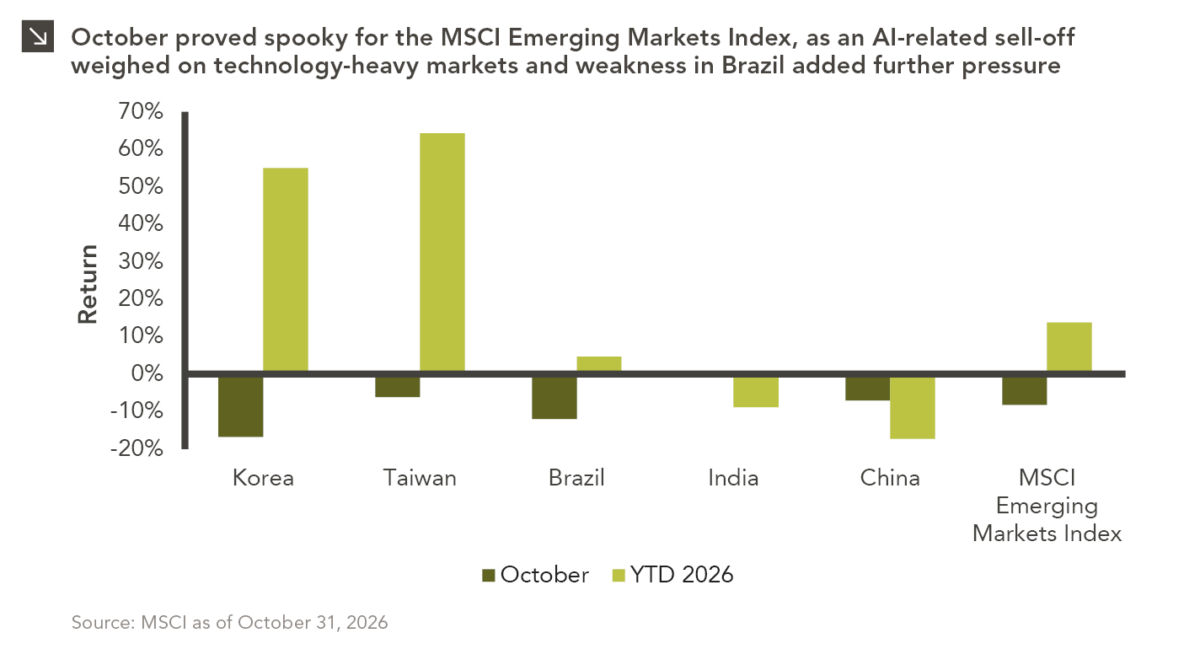
Emerging markets faced a challenging October, with the space declining by around 8.3% amid renewed concerns over the sustainability of…
10.26.2026
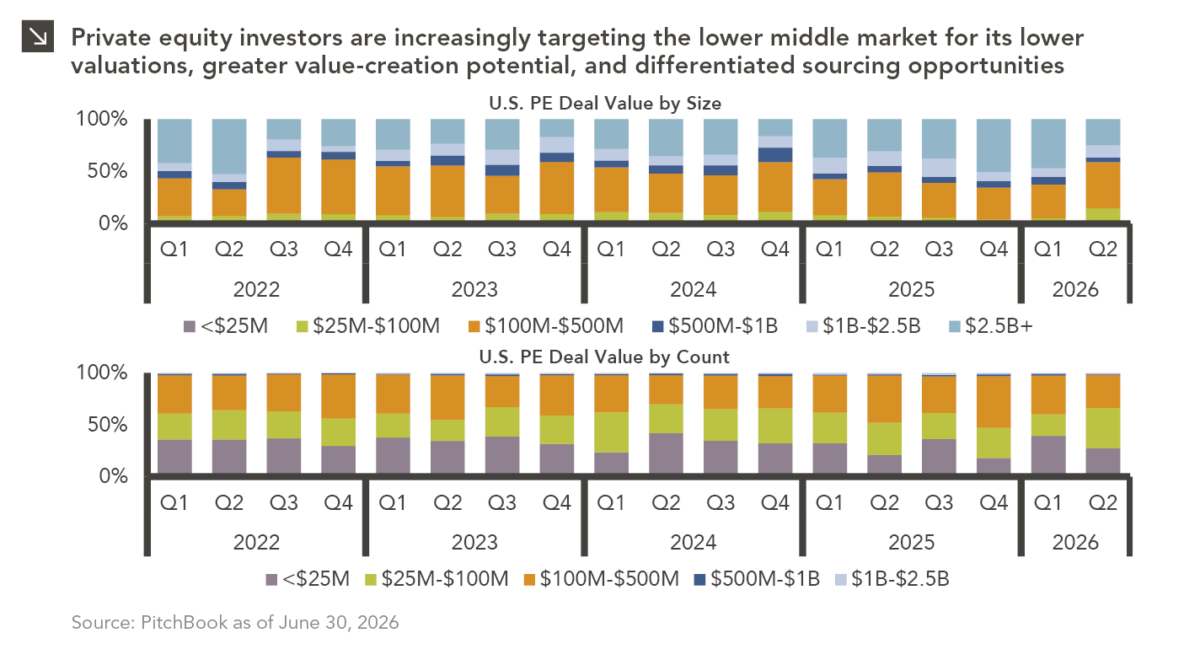
Private equity activity is increasingly shifting toward smaller transactions, with total deal value for transactions of $100 million or less…

10.08.2026
This video is a recording of a live webinar held October 22 by Marquette’s research team analyzing the third quarter…

10.22.2026
Anyone who has run a marathon knows the last six miles are brutal — no matter how well the first…
10.19.2026
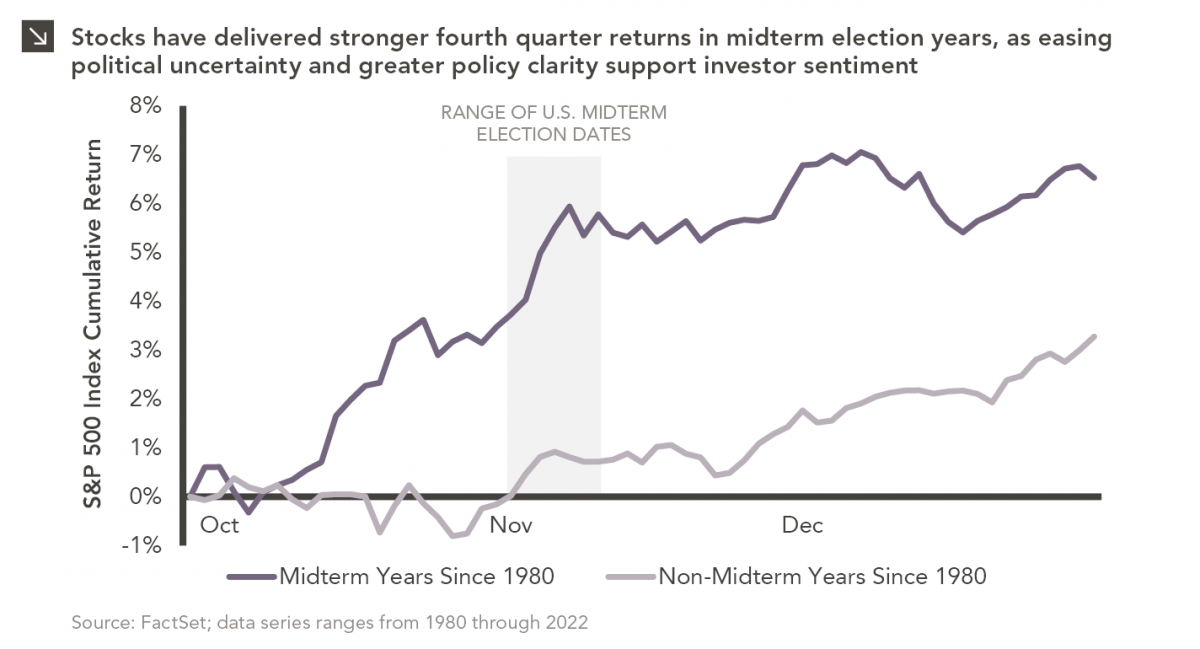
Since 1980, the S&P 500 Index has generally performed well in the weeks surrounding U.S. midterm elections. Specifically, the index…
Research alerts keep you updated on our latest research publications. Simply enter your contact information, choose the research alerts you would like to receive and click Subscribe. Alerts will be sent as research is published.
We respect your privacy. We will never share or sell your information.
If you have questions or need further information, please contact us directly and we will respond to your inquiry within 24 hours.
Contact Us >