Frank Valle, CFA, CAIA
Associate Director of Fixed Income


Going into 2023, one of the primary headlines was the return of “income” to the fixed income asset class. Largely as a result of Fed policy in 2022, yields increased significantly over the course of the year, thus finally offering meaningful income to bond investors. At long last, fixed income could provide all three of its staples to portfolios: diversification, liquidity, AND income. With the Federal Reserve committed to further hikes during the first half of the year, expectations were that the opportunity set would last well into the year.
However, bank failures and the associated fear of contagion have been known to not only fuel volatility in equity and credit markets but send investors to the safety of Treasuries. This dynamic naturally drives prices higher and yields lower as investors look to insulate their portfolios from large drawdowns. That said, the Silicon Valley Bank shutdown coupled with other nervousness around regional banks and then the eventual absorption of Credit Suisse by UBS has not had a significant impact on the outlook for fixed income as of quarter end. After trading inside of 2% since 2020, the yield on the Bloomberg aggregate index closed the first quarter at 4.40%, slightly lower than the December 31, 2022 figure of 4.68% but well ahead of its near-zero value in the years leading up to 2022.
This newsletter analyzes recent market dynamics and the current environment and outlook for fixed income.
Read > Here to Stay? Fixed Income Opportunities Persist Despite First Quarter Volatility

The opinions expressed herein are those of Marquette Associates, Inc. (“Marquette”), and are subject to change without notice. This material is not financial advice or an offer to purchase or sell any product. Marquette reserves the right to modify its current investment strategies and techniques based on changing market dynamics or client needs.
10.26.2026
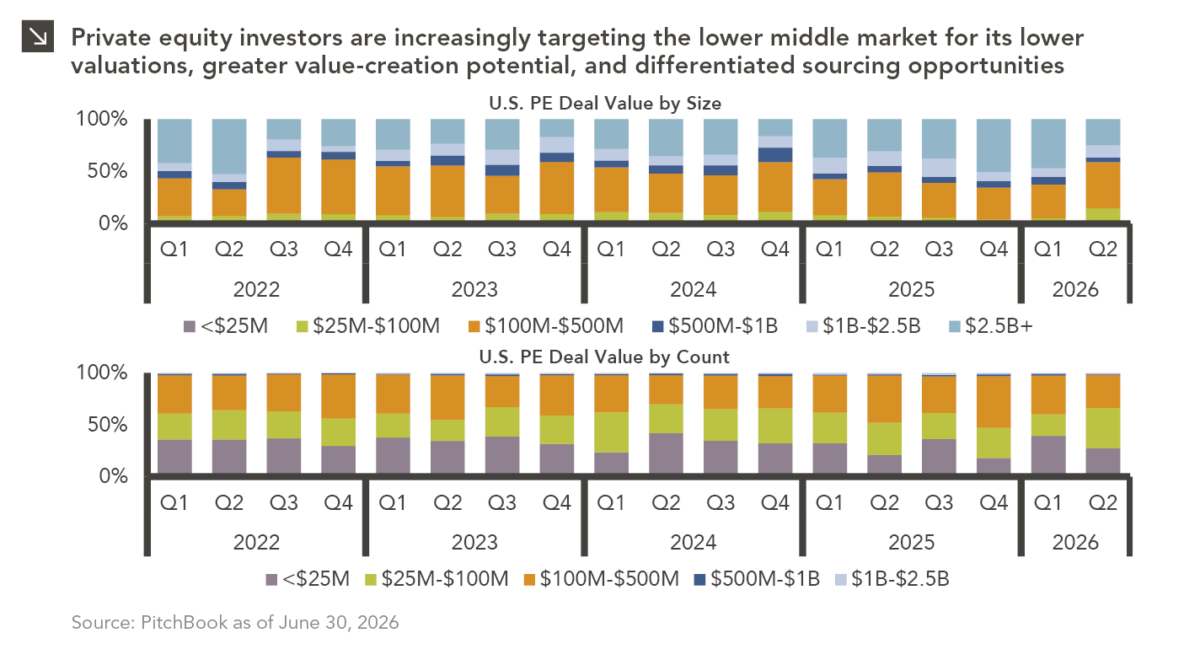
Private equity activity is increasingly shifting toward smaller transactions, with total deal value for transactions of $100 million or less…

10.08.2026
This video is a recording of a live webinar held October 22 by Marquette’s research team analyzing the third quarter…
10.22.2026
Anyone who has run a marathon knows the last six miles are brutal — no matter how well the first…
09.28.2026
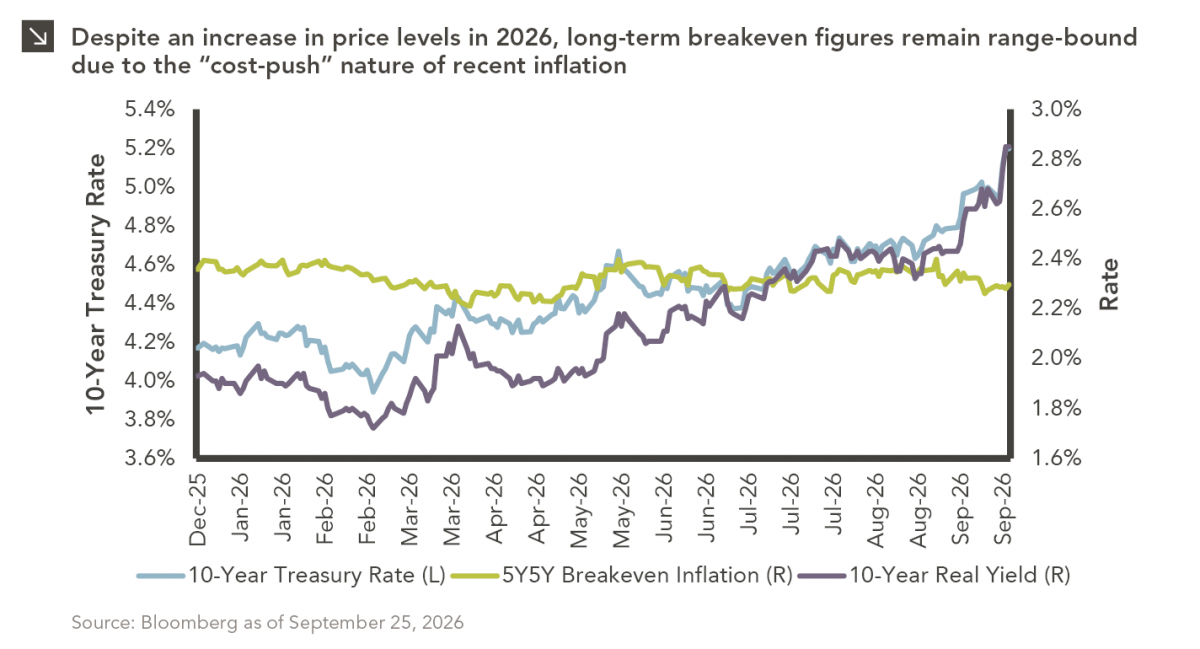
The phrase “expectations of higher inflation” has become a staple in financial news to explain the increase in nominal U.S….
09.21.2026
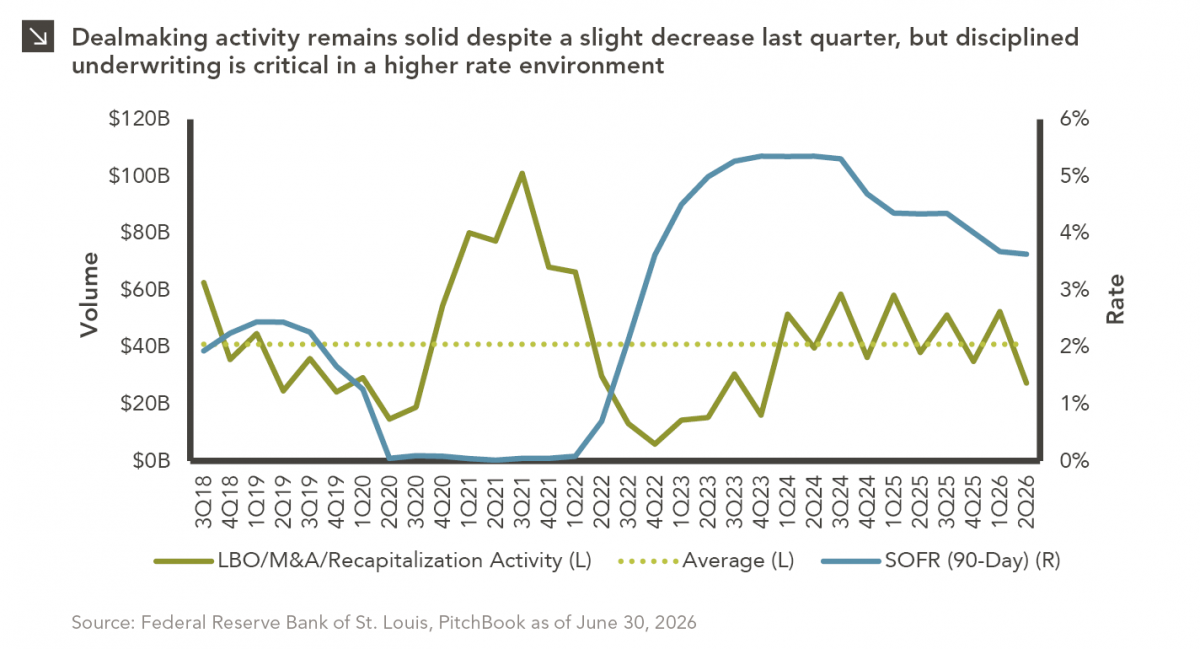
For much of the past several years, the conventional view has been that higher interest rates and stretched valuations would…
09.15.2026
Over the past decade, continuation vehicles (“CV”) have become one of the fastest-growing trends in private equity. Private equity funds…
Research alerts keep you updated on our latest research publications. Simply enter your contact information, choose the research alerts you would like to receive and click Subscribe. Alerts will be sent as research is published.
We respect your privacy. We will never share or sell your information.
If you have questions or need further information, please contact us directly and we will respond to your inquiry within 24 hours.
Contact Us >