Frank Valle, CFA, CAIA
Associate Director of Fixed Income
While most of Marquette’s research is written in the third person, this edition of our Chart of the Week series endeavors to anthropomorphize a key feature of the financial system to provide a unique perspective on the current state of capital markets. The following is what readers might expect to hear from a sentient Treasury curve, which is currently suffering from a prolonged inversion.
I just want to feel “normal” again.
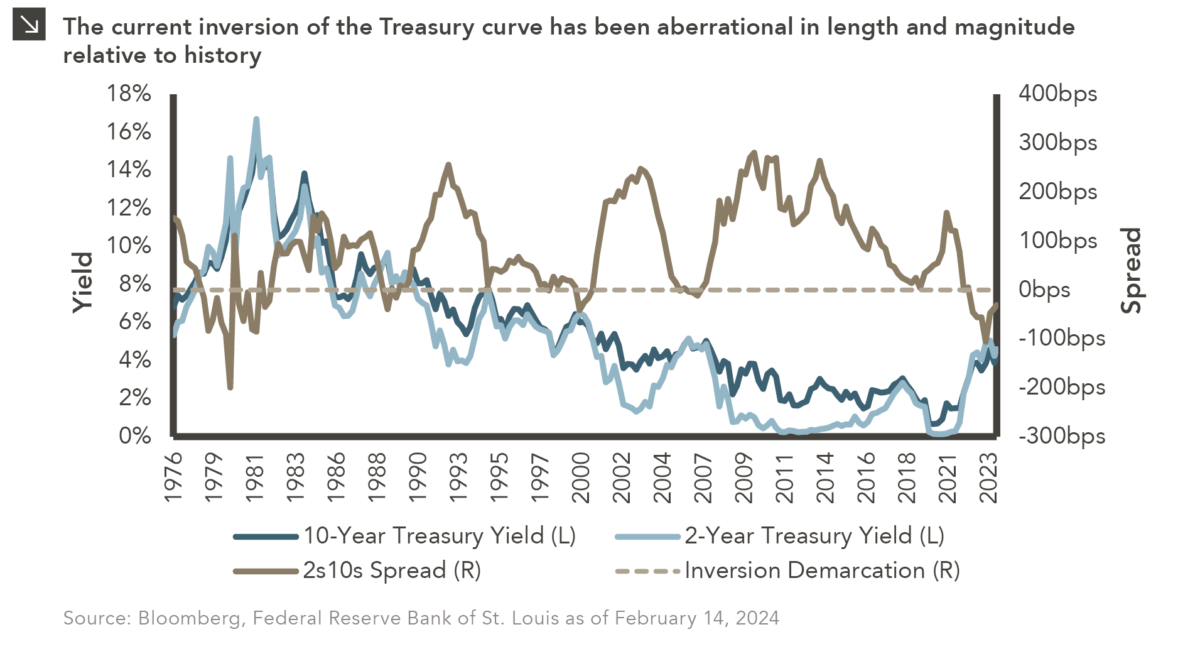
For most of my life, longer-dated bonds have provided higher yields than those with shorter maturities. This is often the case since investors expect increased compensation for the increased risks (e.g., higher duration, lower liquidity, etc.) associated with holding long-term bonds, and I am considered upward sloping and normal when these factors are at play. On certain occasions, however, I have been upended as a result of the reversal of those dynamics, though I have usually been able to snap out of those periods of inversion relatively quickly. To that point, the average length of my inversions was less than one year prior to my current funk, which began in July of 2022 and has yet to abate. During this painful time, the 2-Year Treasury yield has been higher than that of the 10-Year by an average of 54 basis points. Put simply, I feel stuck.
The last time my inversion was this prolonged or this extreme was during a period of roughly 20 months beginning in the late 1970s amid rampant stagflation. Led by Paul Volcker, the Federal Reserve began aggressively raising the federal funds rate in 1978 to combat elevated price levels, and these efforts led to an acute inversion of more than 200 basis points. I was offered a brief respite in May of 1980, but this period of normalization lasted only a few months before short-term rates started moving higher once again. You may remember this period as the “double-dip recession,” but I think the “double-dip inversion” is just as apt a descriptor given my behavior! I have inverted on a few occasions since that difficult time. Specifically, I became inverted again in the late 1980s after a lengthy peacetime expansion drove inflation higher and the federal funds rate increased as a result. Still, that inversion lasted less than a year, as then-Fed Chair Alan Greenspan was forced to cut rates to mitigate a recession that began in 1990. I next became inverted when the Fed increased rates in the early 2000s after the longest period of domestic economic growth to that point. This inversion lasted around seven months before Greenspan came to the rescue once again by cutting rates following the busting of the Dot-Com Bubble, a fall in business investing, and the September 11th attacks. When I became inverted in the lead-up to the Global Financial Crisis, it was Ben Bernanke who straightened me out after just six months.
As I mentioned earlier, my current inversion is particularly pronounced relative to my history, and I have spent the last several months asking myself the following question: How can I get out of this predicament? In theory, longer-dated yields could increase and restore my normalcy, however market participants have such strong demand for long-dated bonds at present that those yields may be range-bound. With that in mind, an appeal to Jerome Powell to lower the federal funds rate may be my only hope. This being the case, you can imagine my dismay at this week’s CPI reading, which came in hotter than expected at 3.1% on a year-over-year basis. Until we see inflation inch closer to the 2.0% target established by the Fed, I believe that Powell will likely hold short-term rates at their current levels and my inversion will continue.
Print PDF
The opinions expressed herein are those of Marquette Associates, Inc. (“Marquette”), and are subject to change without notice. This material is not financial advice or an offer to purchase or sell any product. Marquette reserves the right to modify its current investment strategies and techniques based on changing market dynamics or client needs.

07.27.2026
The rapid growth of non-traded business development companies (BDCs), which are investment vehicles that pool investor capital to make loans…

07.20.2026
Our most recent Chart of the Week publication discussed how the AI investment opportunity has expanded beyond…

07.13.2026
One of the enduring lessons of the California Gold Rush is that the greatest fortunes were often made not by…

07.06.2026
Since traditional exit routes have remained constrained in recent years due to higher interest rates, valuation gaps, and a subdued…

06.29.2026
This week’s chart highlights the varying return profiles across key infrastructure sectors by illustrating the split between income and capital…

06.22.2026
When Benchmark, one of Silicon Valley’s most renowned early-stage venture capital firms, closed $2 billion across two new funds this…
Research alerts keep you updated on our latest research publications. Simply enter your contact information, choose the research alerts you would like to receive and click Subscribe. Alerts will be sent as research is published.
We respect your privacy. We will never share or sell your information.
If you have questions or need further information, please contact us directly and we will respond to your inquiry within 24 hours.
Contact Us >