Inflation: Expectations Matter

September 29, 2022 | Julia Sheehan, Research Analyst

Three-line chart showing the CPI and CPI forecasts. Chart subtitle: According to the Survey of Professional Forecasters, long-term inflation expectations are rising for the first time in decades. Chart visual description: Y-axis is labeled Year over Year % Change and ranges from 0% to +10%. X-axis shows dates ranging from September 2012 to September 2022, in six-month increments. Purple line represents CPI (monthly data); light grey represents SPF 5-Year CPI Forecast (quarterly data), and darker grey line represents SPF 10-Year CPI Forecast (quarterly data). Note that CPI is as of August 2022. Chart data description: Both the 5- and 10-year forecast lines generally hover just slightly above or below 2% until recently, with the 5-year line ticking up to 4% for September 2022 and the 10-year line to 3%. Actual CPI has been typically been less stable than forecasts, though rarely above either forecast. Since March 2021 however, CPI has climbed significantly, peaking in June of this year near 9% and as of August, just below that at 8%. Chart source: Federal Reserve Bank of Philadelphia Survey of Professional Forecasters - Third Quarter 2022. End chart description.

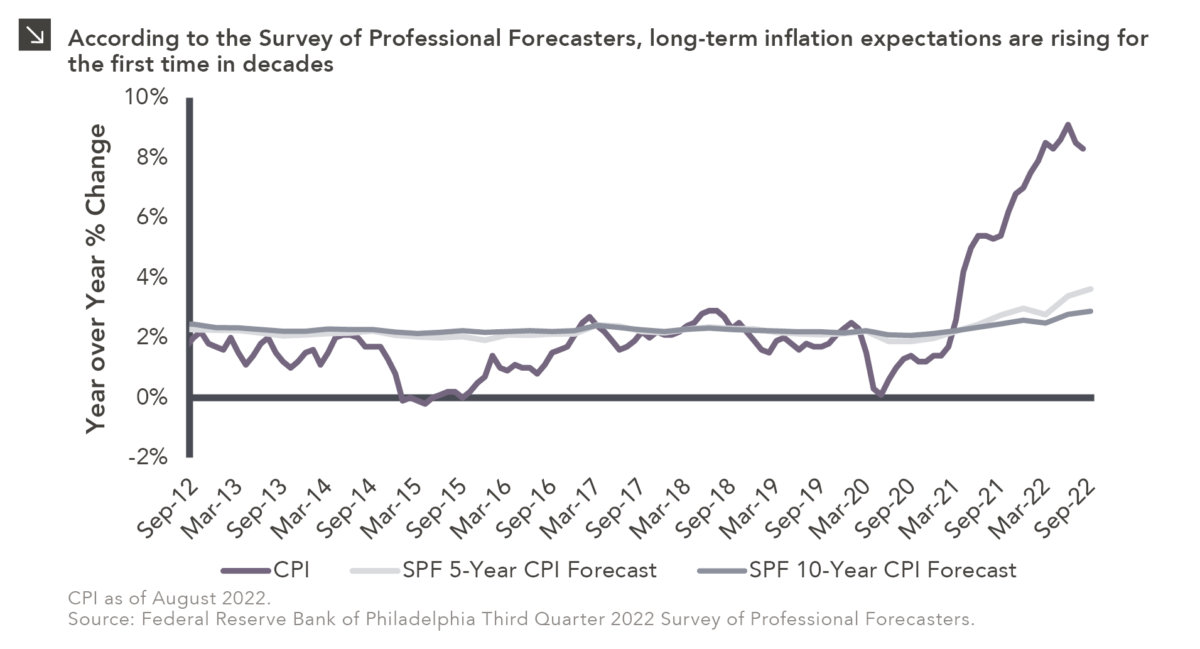
The announcement of another 75 basis point rate hike at last week’s FOMC meeting reaffirmed the Federal Reserve’s unwavering commitment to reducing inflation. One of the key variables the Fed watches to help it determine the path of rates is expected inflation. Inflation can become a self-fulfilling prophecy if consumers start pricing future inflation into their decision-making and businesses start making anticipatory adjustments to their prices and behavior. To combat this, the Fed strives to anchor expectations around a 2% target inflation rate. When long-term inflation forecasts deviate from that 2% target it means inflation expectations are not well-anchored, i.e., people believe that a short-term rise in inflation could lead to higher price levels longer-term.

Inflation expectations have moved further away from the 2% target over the course of 2022, something the Fed recognizes as a potential roadblock in navigating the current inflationary environment. Indeed, Fed Chair Jerome Powell stressed the importance of “expeditiously continuing to raise rates” to “ensure that longer-term inflation expectations remain well-anchored” at the June FOMC press conference.¹ With higher-than-anticipated August CPI figures, however — headline inflation of 8.3% and core inflation that reaccelerated to 6.3% — inflation expectations may remain higher for longer. Headline inflation is moving in the right direction, but core inflation, which remains well above Fed targets, tends to be stickier and may further complicate the Fed’s task. While there are no crystal balls, longer-term inflation expectations will continue to bear monitoring as investors search for potential indicators of a market bottom.

Print PDF > Inflation: Expectations Matter

¹ Lee, J., Powell, T., & Wessel, D. (2022, June 27). What are inflation expectations? Why do they matter? The Brookings Institute. Retrieved September 28, 2022.


The opinions expressed herein are those of Marquette Associates, Inc. (“Marquette”), and are subject to change without notice. This material is not financial advice or an offer to purchase or sell any product. Marquette reserves the right to modify its current investment strategies and techniques based on changing market dynamics or client needs.

Julia Sheehan
Research Analyst

Get to Know Julia

The opinions expressed herein are those of Marquette Associates, Inc. (“Marquette”), and are subject to change without notice. This material is not financial advice or an offer to purchase or sell any product. Marquette reserves the right to modify its current investment strategies and techniques based on changing market dynamics or client needs.

Related Content

Four-line chart showing weight in Bloomberg Aggregate U.S. Bond Index for Treasuries, Government-Related, Corporate, and Securitized sub-indices, 12/31/1999 through 3/31/2026. For date range shown, Treasuries started at 31.7% and end at 45.9%. Government-Related start at 11.4% and end at 4.3%. Corporates start at 20.9% and end at 23.9%. Securitized start at 36.0% and end at 25.9%. For full dataset, please contact marquettemarketing@marquetteassociates.com.

05.18.2026

The “Magnificent One”

Over the last few years, equity markets have been defined by a group of stocks often referred to as the…

Combination column and line chart showing increase in non-renewables and renewables in net installed capacity (GW) in columns and share of new electricity generating capacity by renewables (line) annually since 2005. Renewables ave seen a marked increase in recent years (183.95GW in 2019 to 691.94GW in 2025). Renewable Share was at 86% for 2025. For full dataset, please contact marquettemarketing@marquetteassociates.com.

05.11.2026

A Renewed Focus on Renewables

In addition to the humanitarian toll of the conflict in Iran, the world is currently confronting the impact that trade…

05.07.2026

The Fed Tackles Succession Planning

The leadership structure of the Federal Reserve is intentionally designed to promote continuity, independence, and institutional stability across political cycles….

Stacked column chart showing Weight in S&P 500 Index in 1985, 1995, 2005, 2015, and 2025 for top 10 companies at that time, with companies stacked for each year by weight. From 1985-2015, top 10 weight ranged from 17.6% to 21.1%, but 2025's weight was 40.6%. Company makeup changes over time, with no companies from 1985/1995 categories in 2025. For full dataset, please contact marquettemarketing@marquetteassociates.com.

05.04.2026

This Too Shall Reconstitute

Rooted in medieval Persian Sufi thought, the adage “this too shall pass” speaks to the fleeting and impermanent nature of…

Three-line chart comparing cumulative returns for MSCI EM Latin America Index, MSCI EAFE Index, and S&P 500 Index, Jan 1, 2026 through April 24, 2026. Dashed line at February 28 demarcates U.S. strikes on Iran. While all three indices dipped after war began, Latin America Index was higher to begin with and remains high. Most recent data point (4/24) for Latin America is 20.36%, EAFE is 5.7%, and S&P 500 is 5.06%. For full dataset, please email marquettemarketing@marquetteassociates.com.

04.27.2026

Let’s Hear It for Latin America

Latin American equity markets have shown remarkable strength in 2026. After a strong start to the year, the MSCI Emerging…

04.23.2026

We’ve Seen This Before

Diversify. Rebalance. Stay invested. Every one of these letters has concluded with that same advice in some shape or form….

More articles

Subscribe to Research Email Alerts

Research Email Alert Subscription

Research alerts keep you updated on our latest research publications. Simply enter your contact information, choose the research alerts you would like to receive and click Subscribe. Alerts will be sent as research is published.

We respect your privacy. We will never share or sell your information.

Thank You

We appreciate your interest in Marquette Associates.

If you have questions or need further information, please contact us directly and we will respond to your inquiry within 24 hours.

Contact Us >