10.08.2026
3Q 2026 Market Insights
This video is a recording of a live webinar held October 22 by Marquette’s research team analyzing the third quarter…


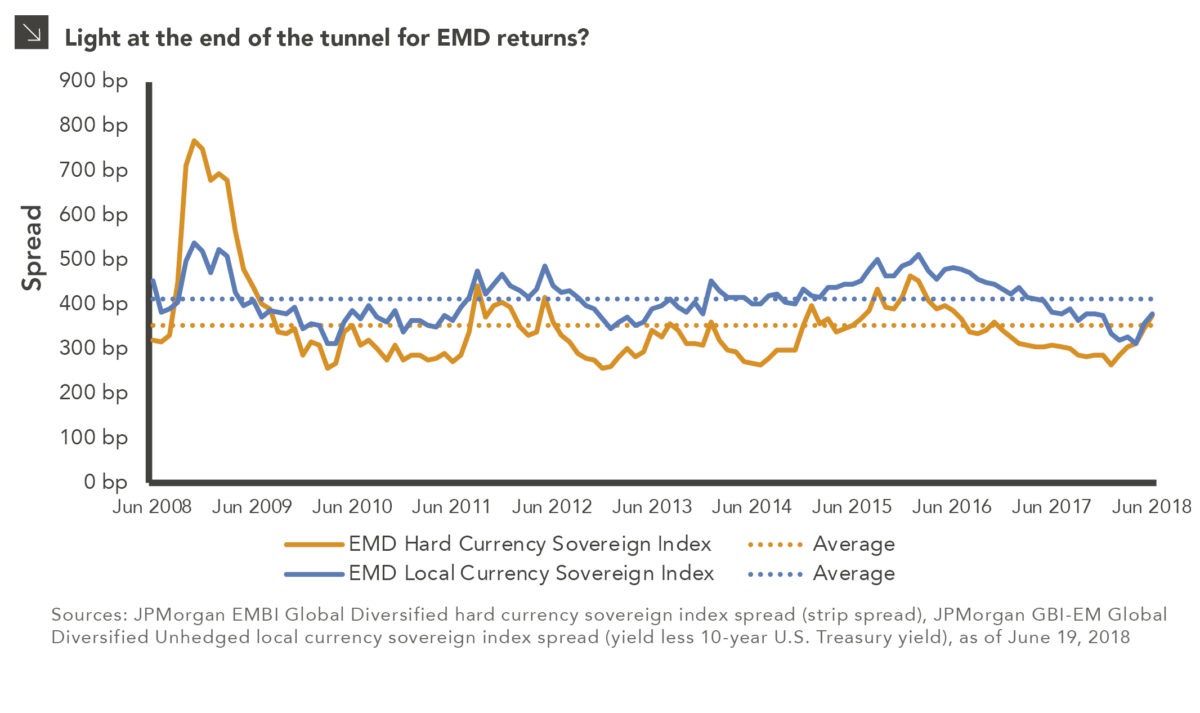
Almost halfway through the year, emerging markets debt (“EMD”) returns are negative for the year, due to a variety of economic and political events. The most commonly cited explanations include the following:
The chart above illustrates how spreads have risen, which has led to higher yields and thus losses for EMD strategies so far in 2018. More specifically, the chart shows the spreads for the hard currency sovereign and local currency sovereign indices versus their averages. The hard currency sovereign index tracks bonds issued by emerging markets countries denominated in U.S. dollars or euros. The local currency sovereign index tracks bonds issued by emerging markets countries denominated in the issuer’s local currency, such as the Brazilian real or Malaysian ringgit.
Looking ahead, it could be argued that tightening by both the Fed and the ECB may slow global growth, raise interest rates, and strengthen currencies in both the U.S. and Europe, none of which would be favorable for EMD returns. However, at this point these moves may already be priced into current yields, and the worst of their impact on returns has already been felt. If so, what’s left are “idiosyncratic” headlines, which should theoretically have less of an impact on future returns.
Ultimately, despite the EMD market’s sensitivity to headlines, EM fundamentals remain strong. Leverage among issuers remains low on an absolute basis and is lower than developed market issuers. GDP growth remains high and is higher than developed market issuers. Furthermore, current account balances and inflation rates are generally improving. These strong fundamentals may suggest an impending reversal in the second half of the year for EMD returns.
The opinions expressed herein are those of Marquette Associates, Inc. (“Marquette”), and are subject to change without notice. This material is not financial advice or an offer to purchase or sell any product. Marquette reserves the right to modify its current investment strategies and techniques based on changing market dynamics or client needs.
The opinions expressed herein are those of Marquette Associates, Inc. (“Marquette”), and are subject to change without notice. This material is not financial advice or an offer to purchase or sell any product. Marquette reserves the right to modify its current investment strategies and techniques based on changing market dynamics or client needs.

10.08.2026
This video is a recording of a live webinar held October 22 by Marquette’s research team analyzing the third quarter…

10.22.2026
Anyone who has run a marathon knows the last six miles are brutal — no matter how well the first…

10.19.2026
Since 1980, the S&P 500 Index has generally performed well in the weeks surrounding U.S. midterm elections. Specifically, the index…

10.12.2026
This week’s chart highlights the accelerating growth of electricity demand in the U.S., which has been driven primarily by the…

10.05.2026
For investors, the spookiest thing about October might not be the ghosts and monsters that are bound to show up…

09.28.2026
The phrase “expectations of higher inflation” has become a staple in financial news to explain the increase in nominal U.S….
Research alerts keep you updated on our latest research publications. Simply enter your contact information, choose the research alerts you would like to receive and click Subscribe. Alerts will be sent as research is published.
We respect your privacy. We will never share or sell your information.
If you have questions or need further information, please contact us directly and we will respond to your inquiry within 24 hours.
Contact Us >