10.08.2026
3Q 2026 Market Insights Webinar
LIVE WEBINAR — OCTOBER 22 Please join Marquette’s research team for our 3Q 2026 Market Insights Webinar…


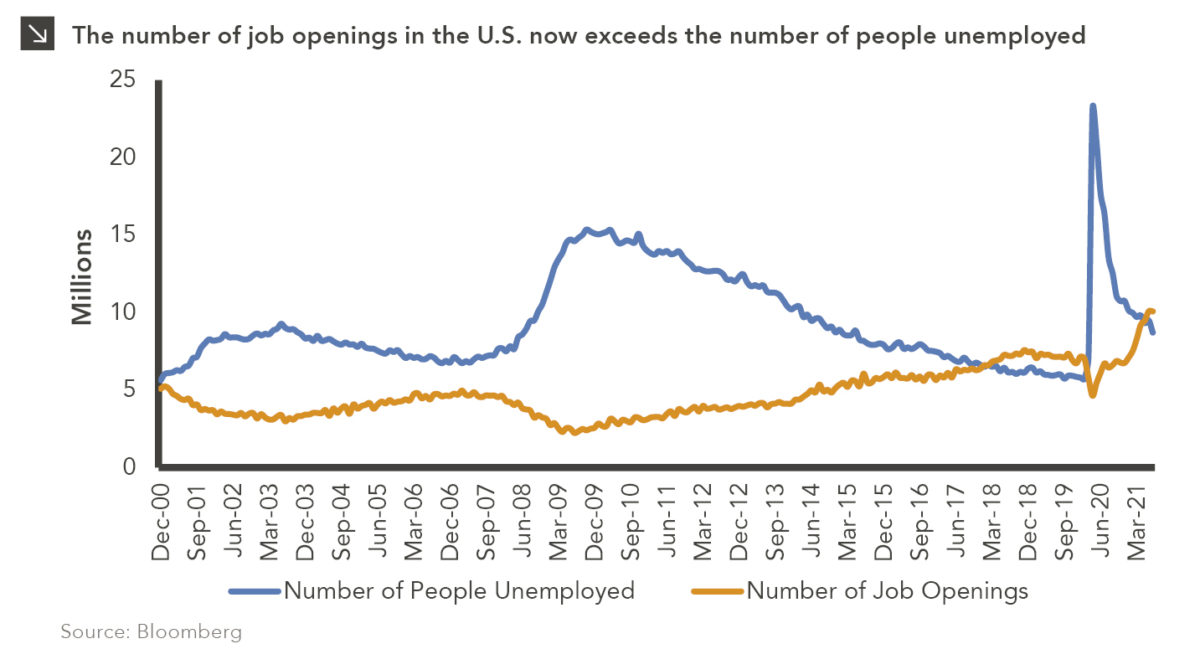
Employers have faced a number of challenges throughout the COVID-19 pandemic — most recently, a labor shortage. As of the end of June, the Bureau of Labor Statistics reported a record high of more than 10 million job openings (including either newly created or unoccupied positions where an employer is taking specific actions to fill those positions), and as of the end of July, 8.7 million people looking for employment (people who are without work, currently available for work and seeking work), creating a disconnect in the labor market.
While this is not the first time job openings have exceeded the number of people looking for work, the imbalance is more meaningful now as companies attempt to fulfill pent-up demand caused by the pandemic with sharply less labor availability. To help combat this shortage, states have started to cut unemployment benefits, though these actions so far seem to have had minimal effect. Employers must now find a way to incentivize workers to apply to openings and accept offers. This is likely to put upward pressure not only on wages but on consumer prices. In order to protect profitability, companies will have to pass on the additional costs to the consumer, adding to inflationary pressures. While many signs point to higher inflation being transitory, the labor shortage — which could continue even after extra unemployment benefits expire, given demographic trends and a shift toward the gig economy — could be a longer-term issue. We will continue to monitor inflation, its underlying drivers, and the potential impacts to our clients’ portfolios carefully.
Print PDF > What Does the Labor Shortage Mean for Inflation?
The opinions expressed herein are those of Marquette Associates, Inc. (“Marquette”), and are subject to change without notice. This material is not financial advice or an offer to purchase or sell any product. Marquette reserves the right to modify its current investment strategies and techniques based on changing market dynamics or client needs.

10.08.2026
LIVE WEBINAR — OCTOBER 22 Please join Marquette’s research team for our 3Q 2026 Market Insights Webinar…

10.05.2026
For investors, the spookiest thing about October might not be the ghosts and monsters that are bound to show up…

09.28.2026
The phrase “expectations of higher inflation” has become a staple in financial news to explain the increase in nominal U.S….

09.21.2026
For much of the past several years, the conventional view has been that higher interest rates and stretched valuations would…

09.14.2026
There are many great things about working at Marquette Associates, but “Free Lunch Tuesday” is right at the top of…

09.08.2026
Over the last several years, emerging market debt (EMD) has faced several headwinds, with rising yields across other fixed income…
Research alerts keep you updated on our latest research publications. Simply enter your contact information, choose the research alerts you would like to receive and click Subscribe. Alerts will be sent as research is published.
We respect your privacy. We will never share or sell your information.
If you have questions or need further information, please contact us directly and we will respond to your inquiry within 24 hours.
Contact Us >