Lockdowns Lead to Slowdown

April 27, 2022 | David Hernandez, CFA, Director of Traditional Manager Search

Combined column and line chart showing China PMI and COVID-19 cases. Chart subtitle: China PMI fell to a 2-year low amid renewed COVID lockdowns. Chart visual description: Chart has two y axes; left displays China PMI, ranging from 25 to 60 and corresponds with light green columns and a dotted line representing 50 as neutral PMI. Right displays 7-day Average New Covid-19 Cases for China, ranging from 0 to 35,000, and corresponding with blue line. X-axis shows monthly increments from 1/29/20 to 3/31/22. Columns align with each month label, but new cases line goes a little further, as of 4/21/22. Chart data description: Most columns are in the range of 51 to 56, but February 2020, August 2021, and March 2022 were all below neutral, at 28.9, 48.9, and 48.8 respectively. 7-day average new cases blipped up to 4,500 in early 2020 as China came to terms with implementing "Zero Covid" policies, then remained flat or very near flat until early 2022. Particularly March into April numbers have grown exponentially, with 4/21 hitting 30,000+. Chart sources: ourworldindata.org, Bloomberg. End chart description.

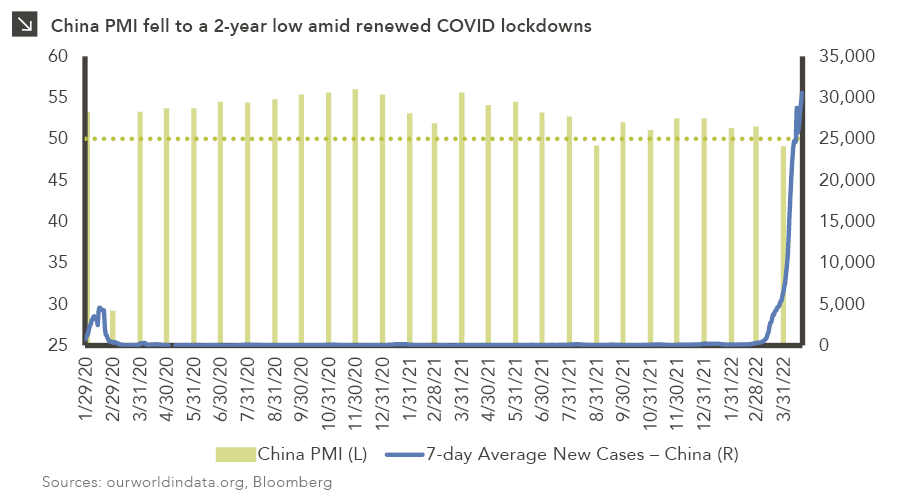
COVID cases have been on the rise in China over the last ten weeks, surpassing February 2020 highs by 800%. The seven-day rolling average has moved from 110 new cases at the end of January 2022 to a high of 30,500 on April 21st. Since the beginning of the pandemic, China has operated with a zero-COVID policy, combining testing and tracing with the use of lockdowns to prevent the spread of the virus. These measures have resulted in an extremely low case count compared to the rest of the world. The country’s recent high near 30,000 is still well below the U.S. seven-day average peak of 800,000 in January 2022.

China’s aggressive use of lockdowns to control the spread of the virus has impacted the country’s economic activity. March’s Purchasing Managers Index (PMI) reading was 48.8, below the neutral 50 mark, indicating a contraction in economic activity. Several Chinese cities are feeling the pressures of the recent lockdown, including Shanghai, a key finance and manufacturing hub. Many investors expect Chinese authorities to step in with supportive policies to help the country navigate the current downturn. Ultimately, however, China may need to choose between two of its seemingly opposing agenda items — its zero-COVID policy and its 5.5% target growth rate — with the choice likely to have material implications for equity markets for the rest of 2022.

Print PDF > Lockdowns Lead to Slowdown


The opinions expressed herein are those of Marquette Associates, Inc. (“Marquette”), and are subject to change without notice. This material is not financial advice or an offer to purchase or sell any product. Marquette reserves the right to modify its current investment strategies and techniques based on changing market dynamics or client needs.

David Hernandez, CFA
Director of Traditional Manager Search

Get to Know David

The opinions expressed herein are those of Marquette Associates, Inc. (“Marquette”), and are subject to change without notice. This material is not financial advice or an offer to purchase or sell any product. Marquette reserves the right to modify its current investment strategies and techniques based on changing market dynamics or client needs.

Related Content

Combination column and line chart showing Net Duties Received (columns, left-hand axis, ranging $0 to $35 billion) and Effective Tariff Rate (line, right-hand axis, ranging 0 to 12%) monthly, from April 2024 through February 2025. Up to March 2025, both data series held relatively steady, averaging around $7B for net duties received, and 2% for effective tariff rate, but both series have quadrupled since then. Most recent (Feb-26) is $26B and 8%. Please contact us for the full data set at marquettemarketing@marquetteassociates.com.

04.13.2026

Liberation Day: One Year Later

On April 2, 2025, President Donald Trump announced a sweeping set of tariffs on imports into the United States. Dubbed…

Line chart showing commercial & industrial loans as percent of total bank credit since 1980. Peak of line is September 1982 at 38%; since then there has been a steady decrease, with several peaks following global crises, with February 2026 datapoint at 21%. Basel I labeled at 1988, Basel II labeled at 2004, Basel III labeled at 2010. For full dataset, please contact marquettemarketing@marquetteassociates.com.

04.06.2026

Regulation Abdication?

The Basel capital framework was created to ensure that banks maintain sufficient capital to absorb losses and reduce the risk…

04.02.2026

1Q 2026 Market Insights Webinar

Please join Marquette’s research team for our 1Q 2026 Market Insights Webinar analyzing the first quarter across the economy and various…

Stacked column chart comparing contribution to total value creation broken out by revenue growth, margin expansion, and multiple expansion for private equity managers, by exit year, 2017 to 2024. 2017 column 45% revenue growth, 26% margin expansion, 29% multiple expansion. 2018 column 56% revenue growth, 4% margin expansion, 40% multiple expansion. 2019 column 43% revenue growth, 10% margin expansion, 47% multiple expansion. 2020 column 42% revenue growth, 19% margin expansion, 39% multiple expansion. 2021 column 46% revenue growth, 13% margin expansion, 42% multiple expansion. 2022 column 53% revenue growth, 20% margin expansion, 27% multiple expansion. 2023 column 64% revenue growth, 19% margin expansion, 17% multiple expansion. 2024 column 71% revenue growth, 12% margin expansion, 17% multiple expansion.

03.30.2026

Pulling the Right Value Creation Levers

In the period between 2009 and 2022, private equity managers thrived amid an environment of low interest rates and rising…

Line chart comparing Brent Crude Futures, WTI Futures, and European Gas Futures from December 2023 to present. Lefthand y-axis labeled Price per Barrel and ranges $0 to $120, corresponding to Brent Crude and WTI data series. Righthand y-axis labeled Price per megawatt Hour and ranges €0 to €70, corresponding to Euro-pean Gas Futures. All three series have spiked in recent weeks, with most recent data as of March 23, 2026 at 100.49 for Brent Crude, 88.72 for WTI, and 54.69 for European gas. Dashed line overlay at February 28 highlighting strikes on Iran.

03.23.2026

Pain at the Pump

Global energy costs have risen sharply this month due to a convergence of geopolitical shocks, as critical infrastructure and transport…

Column chart showing months from first to final close for North American Closed-End Real Estate Funds with average (~10.6 months) overlaid using dotted line. Up to 2020, funds generally stayed below 10 months; in the years since, it is well over, with 2025 at 25 months.

03.16.2026

Closing Time

This week’s chart illustrates a clear structural shift in the fundraising dynamics of North American closed-end real estate funds over…

More articles

Subscribe to Research Email Alerts

Research Email Alert Subscription

Research alerts keep you updated on our latest research publications. Simply enter your contact information, choose the research alerts you would like to receive and click Subscribe. Alerts will be sent as research is published.

We respect your privacy. We will never share or sell your information.

Thank You

We appreciate your interest in Marquette Associates.

If you have questions or need further information, please contact us directly and we will respond to your inquiry within 24 hours.

Contact Us >