Lost in Transaction

January 24, 2024

This chart description is for illustrative purposes only and its accuracy cannot be guaranteed. Please see full disclosures at end of PDF document in the web post. General description: Five-line chart displaying commercial real estate transaction volume in recent years. Chart subtitle: Record low transaction activity has led to pricing opaqueness in the market for commercial real estate. Chart source: RCI, MSCI, AEW Global Real Estate Investment as of December 31, 2023. Chart visual description: Y-axis labeled “Month Over Month Cumulative Transaction Volume,” and ranges from $0B to $1,000B. X-axis is labeled by month. 2019 data plotted in blue line; 2020 in slate; 2021 in purple; 2022 in green, 2023 in orange. Chart data description: Please contact us for the full dataset. Each year’s end total: 2019 $610B, 2020 $440B, 2021 $881B, 2022 $764B, 2023 $369. End chart description. See disclosures at end of document.

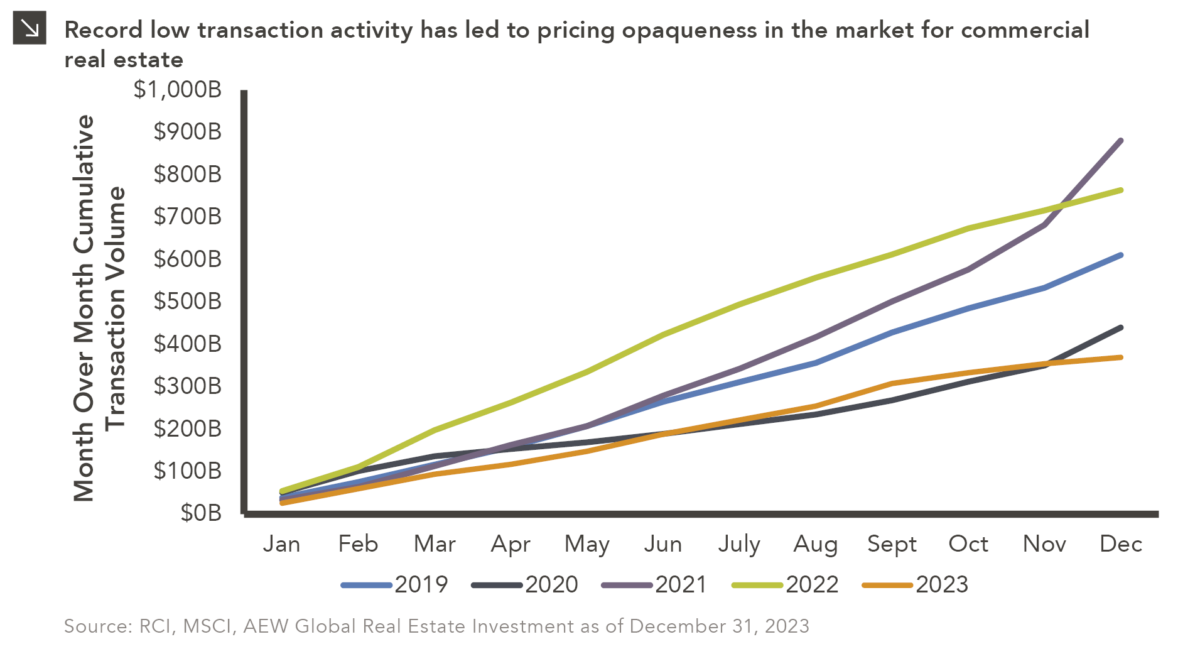
The 10-year Treasury yield notably displayed significant movements throughout 2023. Specifically, it was largely range-bound over the summer (between 3.5%–3.8%), then shot up to around 5.0% in October before falling back down to under 4.0% before year-end. It currently hovers slightly above 4.1%. Thanks in large part to these movements in yields, the real estate market seized up and very few transactions occurred in the fourth quarter of last year. As a result, the full calendar year of 2023 exhibited the lowest transaction volume in the last five years. Limited transactions in the market provide a hurdle for real estate managers and third-party appraisers to accurately determine asset values. As such, the pace of contraction for the private real estate index NCREIF-ODCE has been choppy, with the latest quarter responsible for nearly one-third of the benchmark’s gross return correction of -16.4% since late 2022.

Quarterly returns for the underlying index managers have been volatile in recent time as well. Based on a sample of 18 of the 25 ODCE index funds, the average spread of gross returns over the last five quarters has been nearly 6 percentage points. For context, the longer-term spread is closer to 4 percentage points. Additionally, each fund in that sample has underperformed the ODCE benchmark in at least one of the last six quarters. These figures underscore the notion that recent marks have displayed an elevated degree of dispersion and noise.

Even with the considerable drop in valuations, real estate fundamentals remain relatively healthy outside of the office space. Most do not believe assets are broken, and rent growth still exists within the multifamily, industrial, and self-storage sectors (albeit at lower levels than in prior years). As it relates to the road ahead, real estate investors should remain patient as market dynamics play out. To that point, it may take several quarters for buyers to come off the sidelines, after which more transactions can occur and ultimately be reflected in valuations. Marquette will continue to monitor the real estate landscape while emphasizing the importance of prudence and a long-term perspective.

Print PDF

The opinions expressed herein are those of Marquette Associates, Inc. (“Marquette”), and are subject to change without notice. This material is not financial advice or an offer to purchase or sell any product. Marquette reserves the right to modify its current investment strategies and techniques based on changing market dynamics or client needs.

Related Content

Three-line chart comparing cumulative returns for MSCI EM Latin America Index, MSCI EAFE Index, and S&P 500 Index, Jan 1, 2026 through April 24, 2026. Dashed line at February 28 demarcates U.S. strikes on Iran. While all three indices dipped after war began, Latin America Index was higher to begin with and remains high. Most recent data point (4/24) for Latin America is 20.36%, EAFE is 5.7%, and S&P 500 is 5.06%. For full dataset, please email marquettemarketing@marquetteassociates.com.

04.27.2026

Let’s Hear It for Latin America

Latin American equity markets have shown remarkable strength in 2026. After a strong start to the year, the MSCI Emerging…

Two-line chart showing unemployment rate for All U.S. Workers and Recent College Graduates (Ages 22–27), 12/31/05 to 12/31/25. Up to 2020 period, Recent College Graduates generally had a lower unemployment rate than all U.S. workers category, but since then, the opposite has been true. Lines begin at ~3% to ~5% range in 2005, rose during Global Financial Crisis of '07-'09 to near 10% for All, ~7% for Grads, then both lines declined fairly steadily up to COVID. Peak for both series was 6/30/20, with All at 12.8% and Grads at 13.4%. Most recent data for 12/31/25 is ~4% for All and ~5.5% for Grads. For full dataset, please email marquettemarketing@marquetteassociates.com.

04.20.2026

The Sorrows of Young Workers

Entry-level jobs have traditionally served as the primary bridge between education and stable employment, offering young workers a foothold from…

Combination column and line chart showing Net Duties Received (columns, left-hand axis, ranging $0 to $35 billion) and Effective Tariff Rate (line, right-hand axis, ranging 0 to 12%) monthly, from April 2024 through February 2025. Up to March 2025, both data series held relatively steady, averaging around $7B for net duties received, and 2% for effective tariff rate, but both series have quadrupled since then. Most recent (Feb-26) is $26B and 8%. Please contact us for the full data set at marquettemarketing@marquetteassociates.com.

04.13.2026

Liberation Day: One Year Later

On April 2, 2025, President Donald Trump announced a sweeping set of tariffs on imports into the United States. Dubbed…

Line chart showing commercial & industrial loans as percent of total bank credit since 1980. Peak of line is September 1982 at 38%; since then there has been a steady decrease, with several peaks following global crises, with February 2026 datapoint at 21%. Basel I labeled at 1988, Basel II labeled at 2004, Basel III labeled at 2010. For full dataset, please contact marquettemarketing@marquetteassociates.com.

04.06.2026

Regulation Abdication?

The Basel capital framework was created to ensure that banks maintain sufficient capital to absorb losses and reduce the risk…

04.02.2026

1Q 2026 Market Insights Webinar

This video is a recording of a live webinar held April 16 by Marquette’s research team analyzing the first quarter…

Stacked column chart comparing contribution to total value creation broken out by revenue growth, margin expansion, and multiple expansion for private equity managers, by exit year, 2017 to 2024. 2017 column 45% revenue growth, 26% margin expansion, 29% multiple expansion. 2018 column 56% revenue growth, 4% margin expansion, 40% multiple expansion. 2019 column 43% revenue growth, 10% margin expansion, 47% multiple expansion. 2020 column 42% revenue growth, 19% margin expansion, 39% multiple expansion. 2021 column 46% revenue growth, 13% margin expansion, 42% multiple expansion. 2022 column 53% revenue growth, 20% margin expansion, 27% multiple expansion. 2023 column 64% revenue growth, 19% margin expansion, 17% multiple expansion. 2024 column 71% revenue growth, 12% margin expansion, 17% multiple expansion.

03.30.2026

Pulling the Right Value Creation Levers

In the period between 2009 and 2022, private equity managers thrived amid an environment of low interest rates and rising…

More articles

Subscribe to Research Email Alerts

Research Email Alert Subscription

Research alerts keep you updated on our latest research publications. Simply enter your contact information, choose the research alerts you would like to receive and click Subscribe. Alerts will be sent as research is published.

We respect your privacy. We will never share or sell your information.

Thank You

We appreciate your interest in Marquette Associates.

If you have questions or need further information, please contact us directly and we will respond to your inquiry within 24 hours.

Contact Us >