Evan Frazier, CFA, CAIA
Senior Research Analyst


Marquette regularly sends a senior member of our research team abroad as part of ongoing manager sourcing and due diligence efforts. These trips include update meetings with investment managers with whom Marquette has existing relationships as well as on-site visits with potential new manager recommendations. The cadence of these trips was severely impacted by the COVID-19 pandemic, but with international travel now almost back to normal, Marquette sent Senior Research Analyst Evan Frazier on a whirlwind tour of Europe earlier this summer. Over the course of almost a week, Evan met with eight investment management firms across three cities.
In this newsletter, Evan shares the perspectives, as well as more anecdotal information, he gained while on the ground in Europe, including insights on the region’s economy, the corporate landscape, and the unique set of opportunities and challenges currently facing international markets.
Read > Observations from Across the Pond

The opinions expressed herein are those of Marquette Associates, Inc. (“Marquette”), and are subject to change without notice. This material is not financial advice or an offer to purchase or sell any product. Marquette reserves the right to modify its current investment strategies and techniques based on changing market dynamics or client needs.
10.26.2026
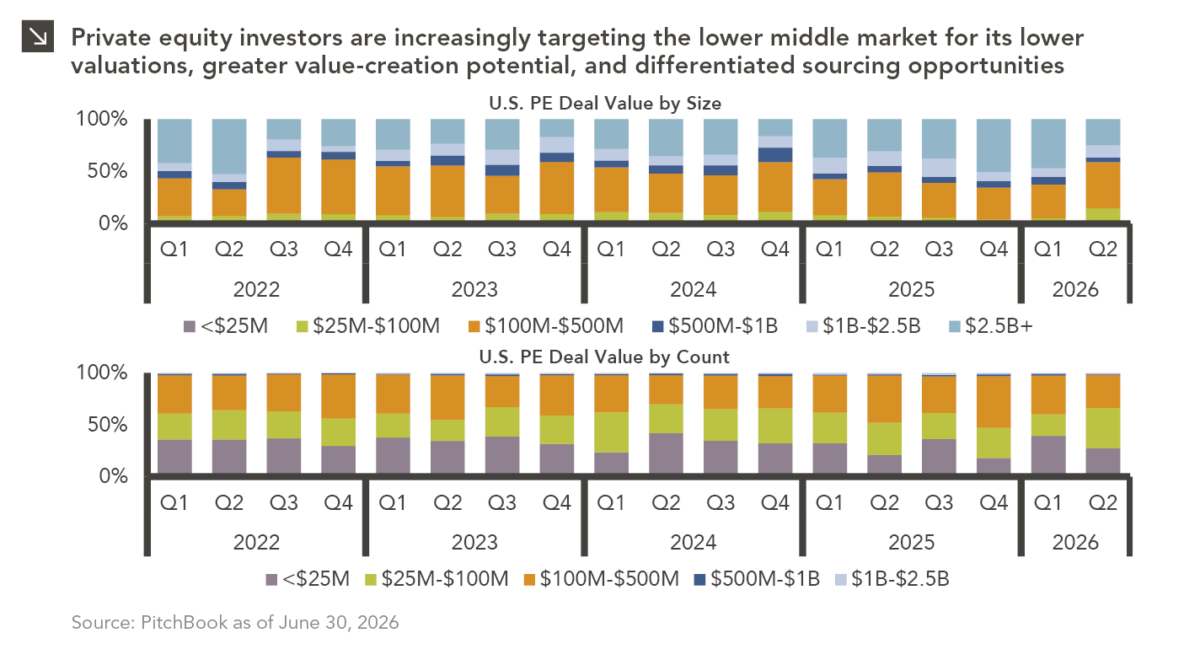
Private equity activity is increasingly shifting toward smaller transactions, with total deal value for transactions of $100 million or less…

10.08.2026
This video is a recording of a live webinar held October 22 by Marquette’s research team analyzing the third quarter…
10.22.2026
Anyone who has run a marathon knows the last six miles are brutal — no matter how well the first…
10.19.2026
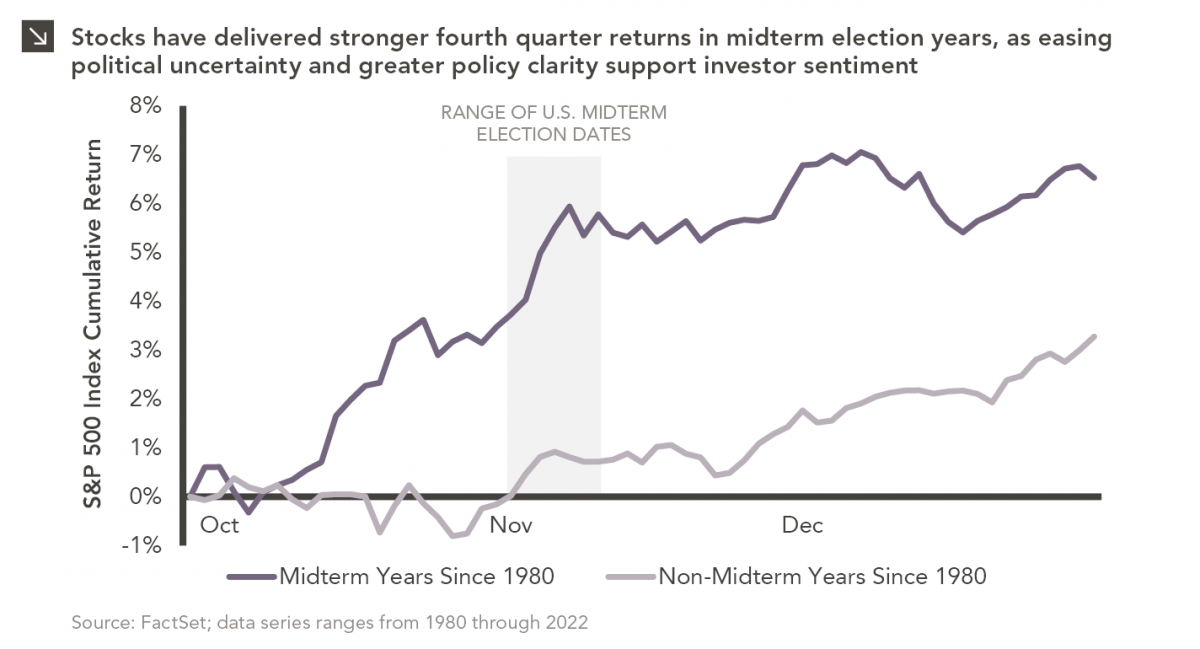
Since 1980, the S&P 500 Index has generally performed well in the weeks surrounding U.S. midterm elections. Specifically, the index…
09.28.2026
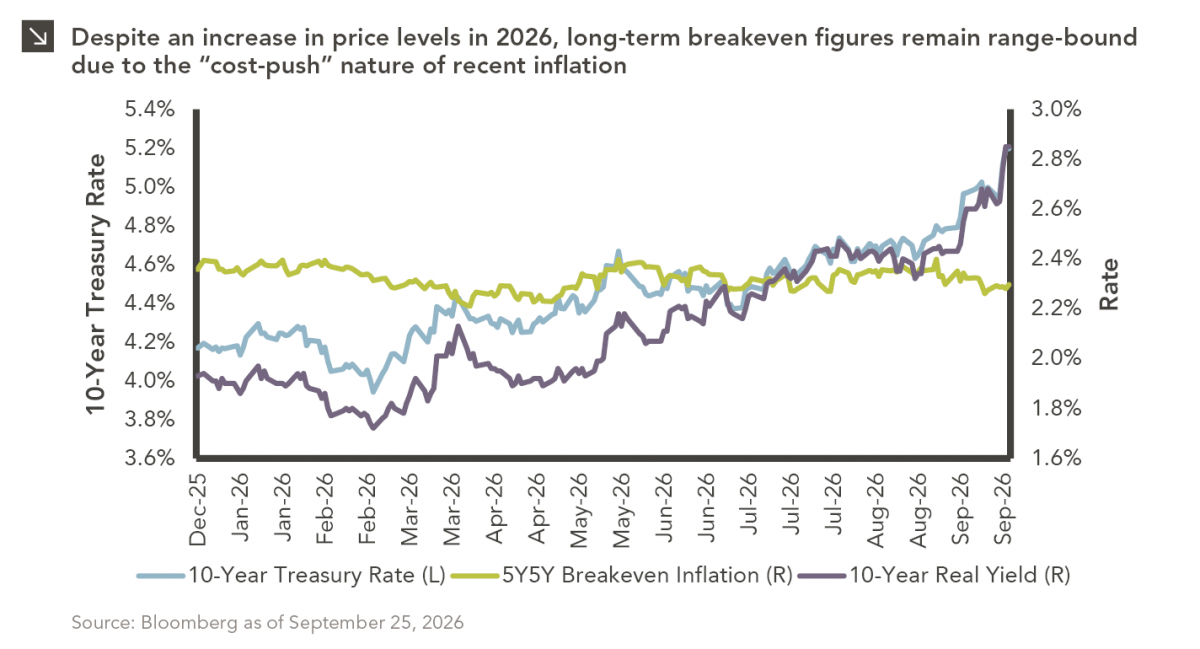
The phrase “expectations of higher inflation” has become a staple in financial news to explain the increase in nominal U.S….
09.21.2026
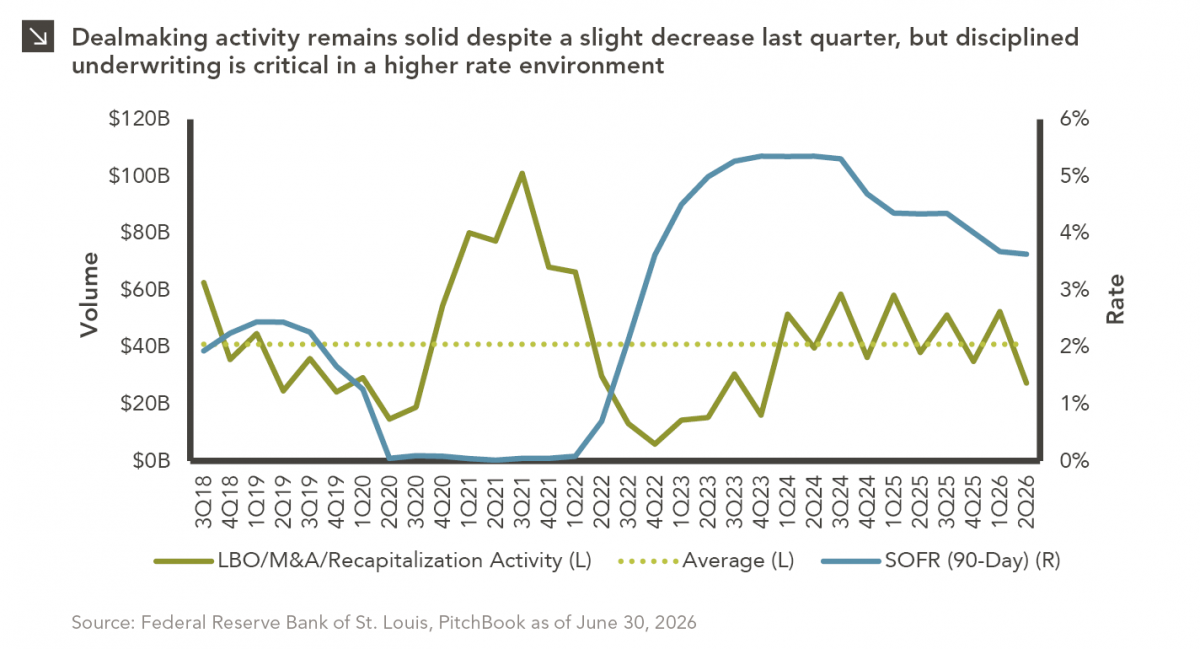
For much of the past several years, the conventional view has been that higher interest rates and stretched valuations would…
Research alerts keep you updated on our latest research publications. Simply enter your contact information, choose the research alerts you would like to receive and click Subscribe. Alerts will be sent as research is published.
We respect your privacy. We will never share or sell your information.
If you have questions or need further information, please contact us directly and we will respond to your inquiry within 24 hours.
Contact Us >