One Year Ago, Would Anyone Have Predicted This?

March 24, 2021 | Jessica Noviskis, CFA, Associate Director

Column chart showing returns for various asset classes a year on from the market bottom in March 2020. Chart subtitle: Markets have bounced sharply off the March 23rd, 2020 bottom. Chart description: Y-axis shows Return, ranging from -60% to +140%. X-axis shows Russell 1000, Russell Mid, Russell 2000, MSCI EAFE, MSCI EAFE SC, MSCI EM, U.S. Aggregate, High Yield, Bank Loan, EMD. Each category has a column for return period 12/31/19 through 3/23/20 and a column for return period 3/23/20-3/23/21. Excluding Agg, all categories were negative for first period by at least 30% and all are positive by about 20%+. Chart source: Bloomberg.

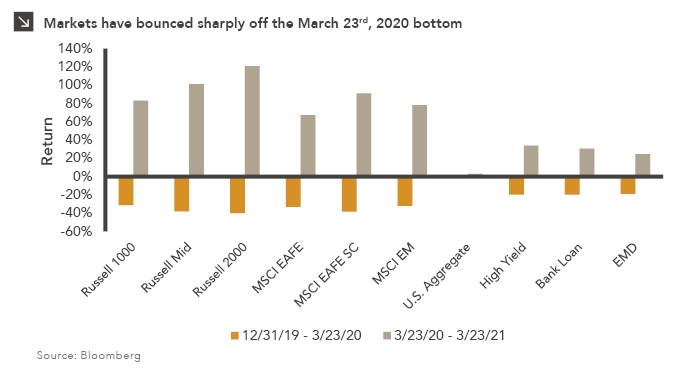
What a year it has been. Officially one year after the equity market’s bottom on March 23rd, 2020, all major indices in the chart above have at least recovered back to ending 2019 levels. The groups that were hit the hardest have also rebounded the strongest, with returns over the last year exceeding 100% for some. Small-cap equities stand out, especially in the U.S. — up 121% over the last year and up 33% over the almost 15-month period since 2019. U.S. mid-cap equities are up 101% over the last year, up 25% over the full period, and U.S. large-cap equities are up 83% over the last year for a 26% return over the full period. Small-cap stocks have also outperformed internationally — the MSCI EAFE Small Cap Index is up 91% over the last year and 18% since 2019, while the MSCI EAFE Index is up 67% over the last year and 12% for the full period. Emerging markets, some of the hardest hit by the crisis last year, have more than recovered, up 78% over the last year for a 22% return since 2019. Fixed income returns have been more muted. Investment grade bonds stayed positive in early 2020 as equity markets fell precipitously and are up another 3% since. High yield bonds, bank loans, and emerging market debt were hit harder but still held up better than equities. Each group has recovered those losses but remains in positive single-digit territory over the full period.

From here, we expect returns will likely moderate. As the vaccine roll-out continues we expect further economic re-openings and renewed growth across the globe, but it seems highly unlikely capital markets returns can continue at this pace beyond the initial recovery.

Print PDF > One Year Ago, Would Anyone Have Predicted This?


The opinions expressed herein are those of Marquette Associates, Inc. (“Marquette”), and are subject to change without notice. This material is not financial advice or an offer to purchase or sell any product. Marquette reserves the right to modify its current investment strategies and techniques based on changing market dynamics or client needs.

Jessica Noviskis, CFA
Associate Director

Get to Know Jessica

Related Content

This chart description is for illustrative purposes only and its accuracy cannot be guaranteed. Please see full disclosures at end of PDF document in the web post. General description: Combination column and line chart comparing recent holiday spending by U.S. consumers. Chart subtitle: Spending is on track to reach record levels this holiday season, despite mounting economic pressures faced by American consumers. Chart source: Adobe Analytics and CNN Business as of October 31, 2023. Chart description: Left Y-axis is labeled “Spending” and ranges from $0B to $250B. Right Y-axis is labeled “YoY Growth” and ranges from 0% to 50%. X-axis labels each column: 2019, 2020, 2021, 2022, and 2023 (Projected). Holiday Spending by U.S. Consumers is plotted in dark teal columns. Holiday Spending Growth is plotted with light purple line and markers. 2019 saw $143B in spending and 13.1% YoY growth; 2020 $188B, 32.1%; 2021 $205B, 8.7%; 2022 $212B, 3.5%, and 2023 is projected at $222B and 4.8%. End chart description. See disclosures at end of document.

11.30.2023

‘Tis the Season to Spend!

The holiday spending frenzy is well underway as some of the biggest shopping days of the year, including Black Friday…

11.16.2023

The Taming of the VIX

October proved tumultuous for investors as all major U.S. equity indices were negative and the CBOE VIX Index, which serves…

This chart description is for illustrative purposes only and its accuracy cannot be guaranteed. Please see full disclosures at end of PDF document in the web post. General description: Combination stacked column and line chart comparing unrealized gains/losses with effective federal funds rate. Chart subtitle: Unrealized losses across depository institutions have increased in recent quarters thanks to higher interest rates. Chart source: Federal Deposit Insurance Corporation and Federal Reserve Bank of St. Louis as of June 30, 2023. Chart description: Left Y-axis is labeled “Unrealized Gains/Losses” and ranges from -$800B to +$800B, corresponding to stacked columns. Right Y-axis is labeled “Rate” and ranges from -6% to +6%, corresponding to line. X-axis ranges from 1Q08 to 2Q23; labels are at 3-quarter increments to fit so last label is for 1Q23. Available-For-Sale Securities are plotted in dark green base of stacked columns; Held-To-Maturity Securities are plotted in lighter green as second half of column. Effect Federal Funds Rate line is plotted in light blue. Unrealized losses are at significant levels for chart losses; since the fed funds rate has increased since 1Q22, losses have totaled over $300B. Most recent datapoints, as of 2Q23 are as follows: Available-For-Sale Securities at -$248.9B, Held-To-Maturity Securities at -$309.6B, and Effective Federal Funds Rate at 5.3%. Please contact us for the full dataset. End chart description. See disclosures at end of document.

11.08.2023

Realizing the Impact of Unrealized Losses

Earlier this year, the regional banking crisis and eventual collapses of Silicon Valley Bank, Signature Bank, First Republic Bank, and…

This chart description is for illustrative purposes only and its accuracy cannot be guaranteed. Please see full disclosures at end of PDF document in the web post. General description: Three-line chart showing cumulative return for various U.S. equity indices. Chart subtitle: Domestic stock indices enter correction territory after recent slide. Chart source: Bloomberg as of October 31, 2023. Chart description: Y-axis is labeled “Cumulative Return” and ranges from -15% to +10%. X-axis is labeled in monthly increments, from Jun-23 to Oct-23. Data ranges 6/30/23 through 10/31/23. S&P 500 Index is plotted in orange line, Nasdaq-100 Index in light tan line, and Russell 2000 Index in dark purple line. Most recent data points, respectively, -5.31%, -4.84%, -11.61%. Please contact us for the full dataset. End chart description. See disclosures at end of document.

11.01.2023

The Chart for Red October

U.S. equities declined for the third consecutive month in October amid an environment of higher yields and underwhelming earnings reports…

10.13.2023

3Q 2023 Market Insights Video

This video is a recording of a live webinar held on October 26 by Marquette’s research team, featuring in-depth analysis…

10.26.2023

Portfolio Trick or Treat

Coming into 2023, investors were cautiously optimistic about 2023 market returns; cautious considering the broad losses across asset classes during…

More articles

Subscribe to Research Email Alerts

Research Email Alert Subscription

Research alerts keep you updated on our latest research publications. Simply enter your contact information, choose the research alerts you would like to receive and click Subscribe. Alerts will be sent as research is published.

We respect your privacy. We will never share or sell your information.

Thank You

We appreciate your interest in Marquette Associates.

If you have questions or need further information, please contact us directly and we will respond to your inquiry within 24 hours.

Contact Us >