Chad Sheaffer, CFA, CAIA
Associate Director of Private Credit


Alternative credit, also referred to as private credit or private debt, has emerged as an area of significant interest for investors in recent time, offering attractive returns and distinct advantages compared to liquid credit markets across an array of strategy offerings. Over the last decade, alternative credit managers have stepped in to play a critical role within lending markets as traditional lenders (i.e., banks) have retreated in the face of liquidity constraints, more stringent regulatory requirements, and higher borrowing costs. As bank retrenchment has intensified, non-traditional credit providers have gained further prominence by offering stable, efficient, and long-term sources of funding for borrowers while also generating attractive returns for investors. Indeed, the leveraged credit market has grown rapidly since the Global Financial Crisis, evolving into a return-enhancing asset class with diversification benefits relative to public fixed income. Given current trends related to supply and demand for capital, as well as the efficiency with which providers can supply favorable loans within corporate capital structures, we expect alternative credit strategies will continue to offer attractive opportunities for investors going forward. However, while the broad opportunity set is particularly attractive, it is important to note that there are many types of strategies that fall into the alternative credit category, and each of these strategies offers varied risk, return, and liquidity characteristics. As it relates to risk broadly, investors should understand how the economic cycle, illiquidity risks, default rates, and increasing competition for deal flow can impact the asset class.
While Marquette has been an active participant in alternative credit markets for many years, the proliferation of the asset class and the expansion of offerings available to investors of different profiles serve as an impetus to examine the space in further detail. The aim of this whitepaper is to provide a background on the alternative credit space, highlight some of the key drivers of return and risk across various alternative credit strategies, and outline the prospects of the asset class going forward.
Read > A Primer on Alternative Credit

The opinions expressed herein are those of Marquette Associates, Inc. (“Marquette”), and are subject to change without notice. This material is not financial advice or an offer to purchase or sell any product. Marquette reserves the right to modify its current investment strategies and techniques based on changing market dynamics or client needs.
10.26.2026
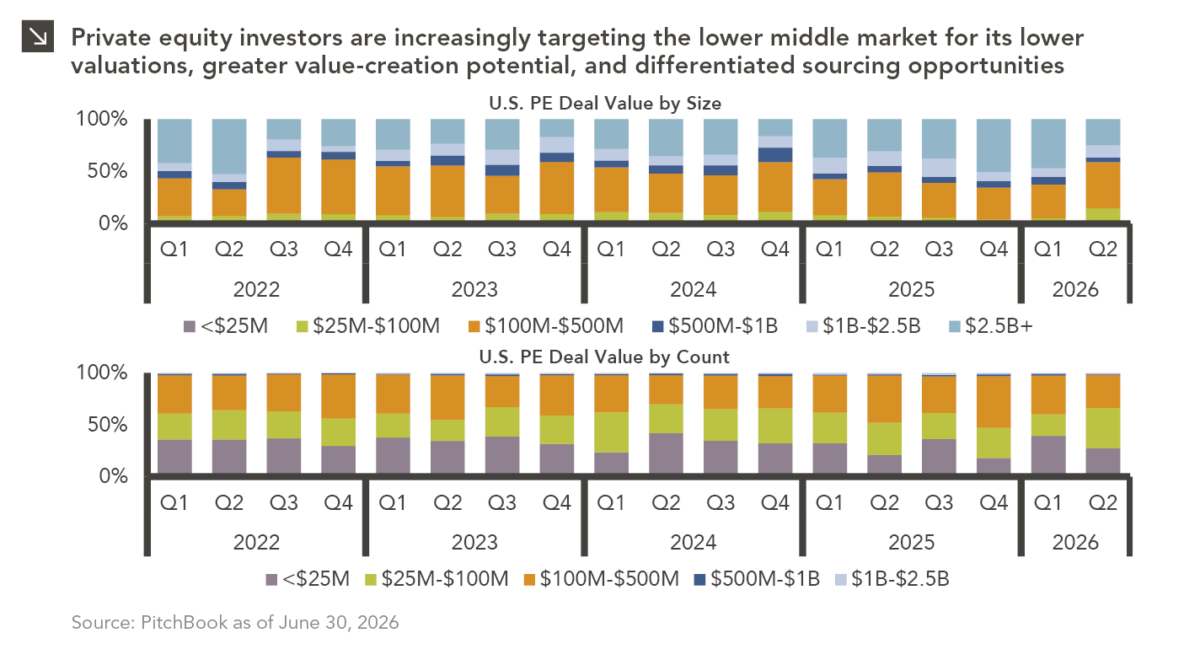
Private equity activity is increasingly shifting toward smaller transactions, with total deal value for transactions of $100 million or less…

10.08.2026
This video is a recording of a live webinar held October 22 by Marquette’s research team analyzing the third quarter…

10.22.2026
Anyone who has run a marathon knows the last six miles are brutal — no matter how well the first…
09.28.2026
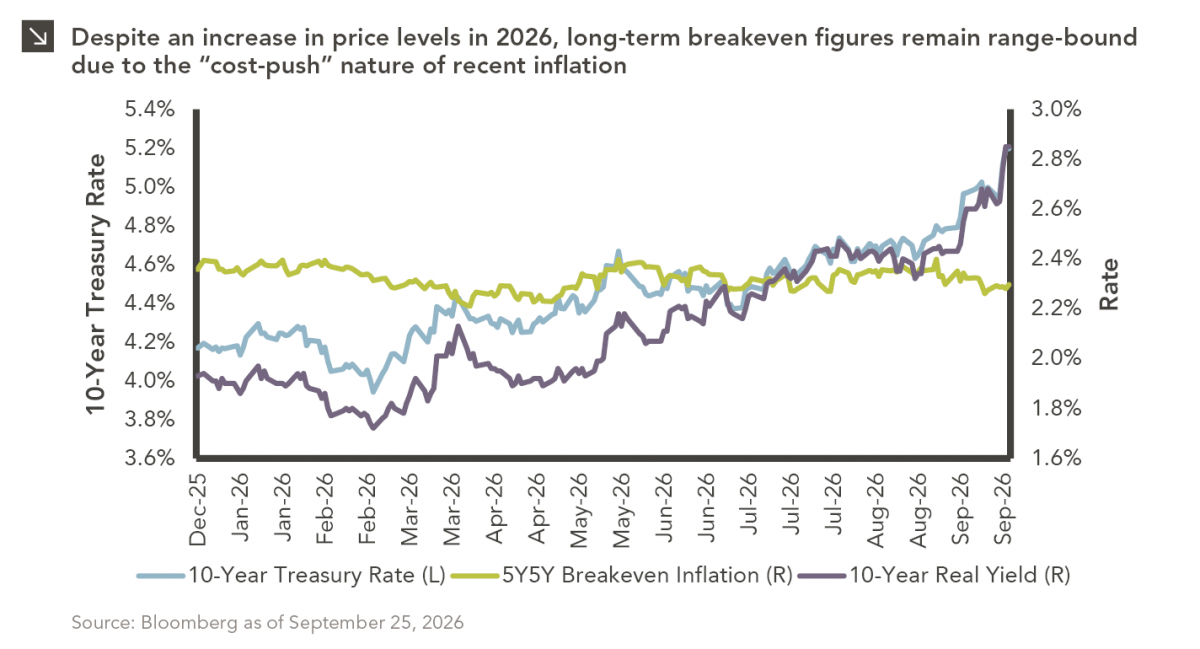
The phrase “expectations of higher inflation” has become a staple in financial news to explain the increase in nominal U.S….
09.21.2026
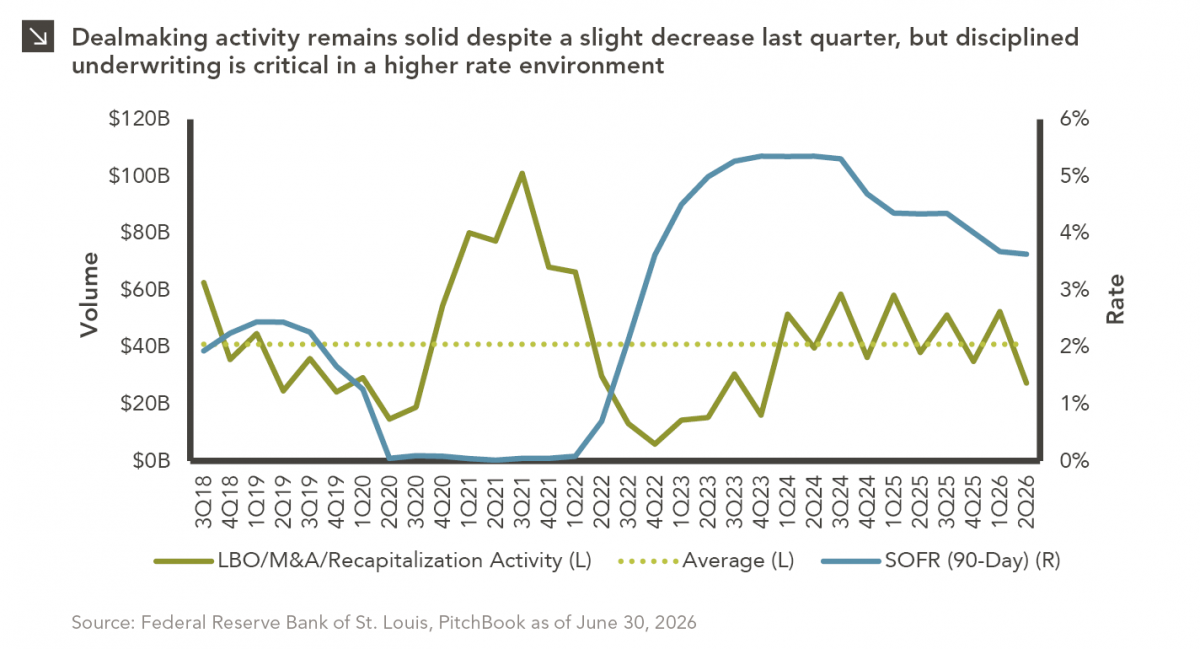
For much of the past several years, the conventional view has been that higher interest rates and stretched valuations would…
09.14.2026
There are many great things about working at Marquette Associates, but “Free Lunch Tuesday” is right at the top of…
Research alerts keep you updated on our latest research publications. Simply enter your contact information, choose the research alerts you would like to receive and click Subscribe. Alerts will be sent as research is published.
We respect your privacy. We will never share or sell your information.
If you have questions or need further information, please contact us directly and we will respond to your inquiry within 24 hours.
Contact Us >