Private Equity Staying Rational with Fund Sizes

July 29, 2021

Column/line chart showing PE fund size step-ups and increased fund sizes. Chart subtitle: Private equity fund size step-ups have remained consistent over the last decade. Chart description: Left y-axis ranges percent from 0-100%. X-axis goes by years from 2007 to 1H2021. Columns in purple show % PE Funds Raising Greater Fund Size; line in gray shows Median % Fund Size Step-Up. Ranges for both categories are fairly consistent; columns hover near 70% and line has larger range but has hovered between 30% and 51% for the past ten years. The lowest year for both categories was 2010, with 65% and 22% respectively. As of 1H2021, 72% of PE funds are raising greater fund sizes and the median fund size step-up is 48%. Chart source: Pitchbook 2Q 2021 U.S. PE Breakdown.

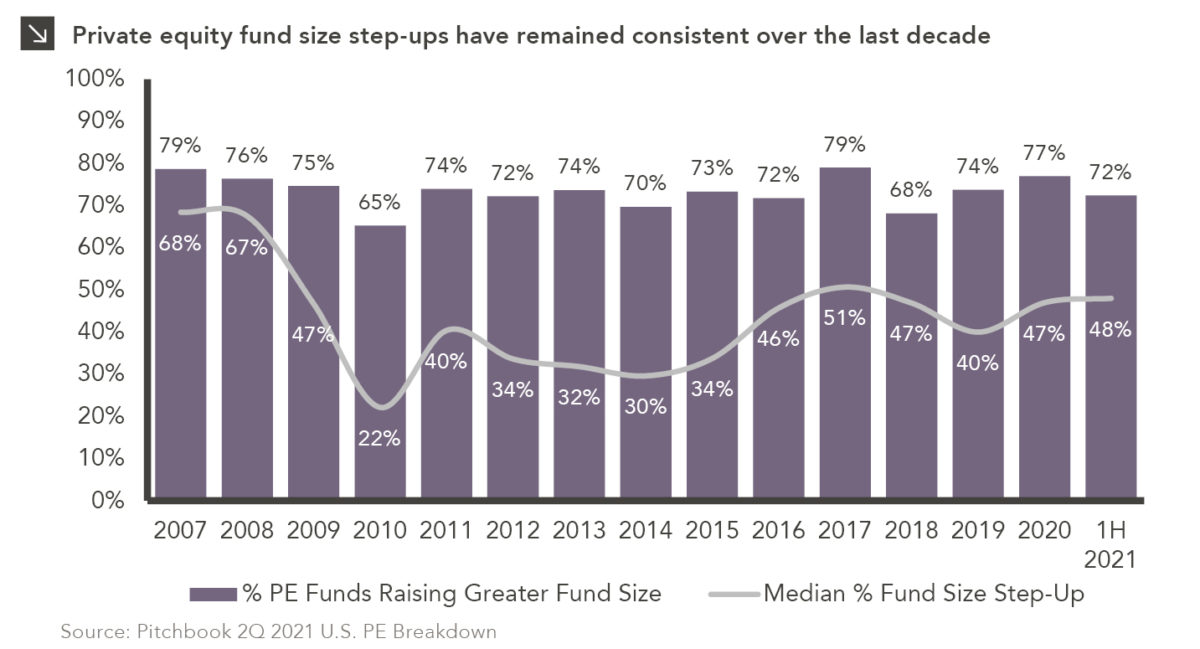
Despite strong fundraising numbers in recent years, private equity managers in the U.S. have stayed consistent with subsequent fund size step-ups. Through the first half of 2021, 72% of private equity managers launched funds with increased size targets, in line with the average over the last decade. The median fund size step-up in the first half of the year was 48%, modestly above the 40% average increase over the last decade, but in line with the industry average over the last five years.

Fund size is a critical factor for private equity investors to consider, as it can push a manager outside their strategy, require additional resources, require purchasing larger businesses that are more efficient, and/or take managers longer to deploy. That said, modest fund size growth is healthy for a private equity organization, allowing for internal growth, giving existing investors the ability to scale their allocations, and creating opportunities to bring new investors into the fund. Risks related to increased fund size can be mitigated by managers via scaled resources, targeting more portfolio companies, reducing the amount of co-investment offered, and/or reducing leverage — all things we look for in our due diligence process. We believe modest growth is healthy and to be encouraged if done responsibly, but we do carefully evaluate the magnitude of a fund size increase relative to our assessment of a manager’s capacity and strategy.

Print PDF > Private Equity Staying Rational with Fund Sizes


The opinions expressed herein are those of Marquette Associates, Inc. (“Marquette”), and are subject to change without notice. This material is not financial advice or an offer to purchase or sell any product. Marquette reserves the right to modify its current investment strategies and techniques based on changing market dynamics or client needs.

The opinions expressed herein are those of Marquette Associates, Inc. (“Marquette”), and are subject to change without notice. This material is not financial advice or an offer to purchase or sell any product. Marquette reserves the right to modify its current investment strategies and techniques based on changing market dynamics or client needs.

Related Content

Three-line chart comparing cumulative returns for MSCI EM Latin America Index, MSCI EAFE Index, and S&P 500 Index, Jan 1, 2026 through April 24, 2026. Dashed line at February 28 demarcates U.S. strikes on Iran. While all three indices dipped after war began, Latin America Index was higher to begin with and remains high. Most recent data point (4/24) for Latin America is 20.36%, EAFE is 5.7%, and S&P 500 is 5.06%. For full dataset, please email marquettemarketing@marquetteassociates.com.

04.27.2026

Let’s Hear It for Latin America

Latin American equity markets have shown remarkable strength in 2026. After a strong start to the year, the MSCI Emerging…

Two-line chart showing unemployment rate for All U.S. Workers and Recent College Graduates (Ages 22–27), 12/31/05 to 12/31/25. Up to 2020 period, Recent College Graduates generally had a lower unemployment rate than all U.S. workers category, but since then, the opposite has been true. Lines begin at ~3% to ~5% range in 2005, rose during Global Financial Crisis of '07-'09 to near 10% for All, ~7% for Grads, then both lines declined fairly steadily up to COVID. Peak for both series was 6/30/20, with All at 12.8% and Grads at 13.4%. Most recent data for 12/31/25 is ~4% for All and ~5.5% for Grads. For full dataset, please email marquettemarketing@marquetteassociates.com.

04.20.2026

The Sorrows of Young Workers

Entry-level jobs have traditionally served as the primary bridge between education and stable employment, offering young workers a foothold from…

Combination column and line chart showing Net Duties Received (columns, left-hand axis, ranging $0 to $35 billion) and Effective Tariff Rate (line, right-hand axis, ranging 0 to 12%) monthly, from April 2024 through February 2025. Up to March 2025, both data series held relatively steady, averaging around $7B for net duties received, and 2% for effective tariff rate, but both series have quadrupled since then. Most recent (Feb-26) is $26B and 8%. Please contact us for the full data set at marquettemarketing@marquetteassociates.com.

04.13.2026

Liberation Day: One Year Later

On April 2, 2025, President Donald Trump announced a sweeping set of tariffs on imports into the United States. Dubbed…

Line chart showing commercial & industrial loans as percent of total bank credit since 1980. Peak of line is September 1982 at 38%; since then there has been a steady decrease, with several peaks following global crises, with February 2026 datapoint at 21%. Basel I labeled at 1988, Basel II labeled at 2004, Basel III labeled at 2010. For full dataset, please contact marquettemarketing@marquetteassociates.com.

04.06.2026

Regulation Abdication?

The Basel capital framework was created to ensure that banks maintain sufficient capital to absorb losses and reduce the risk…

04.02.2026

1Q 2026 Market Insights Webinar

This video is a recording of a live webinar held April 16 by Marquette’s research team analyzing the first quarter…

Stacked column chart comparing contribution to total value creation broken out by revenue growth, margin expansion, and multiple expansion for private equity managers, by exit year, 2017 to 2024. 2017 column 45% revenue growth, 26% margin expansion, 29% multiple expansion. 2018 column 56% revenue growth, 4% margin expansion, 40% multiple expansion. 2019 column 43% revenue growth, 10% margin expansion, 47% multiple expansion. 2020 column 42% revenue growth, 19% margin expansion, 39% multiple expansion. 2021 column 46% revenue growth, 13% margin expansion, 42% multiple expansion. 2022 column 53% revenue growth, 20% margin expansion, 27% multiple expansion. 2023 column 64% revenue growth, 19% margin expansion, 17% multiple expansion. 2024 column 71% revenue growth, 12% margin expansion, 17% multiple expansion.

03.30.2026

Pulling the Right Value Creation Levers

In the period between 2009 and 2022, private equity managers thrived amid an environment of low interest rates and rising…

More articles

Subscribe to Research Email Alerts

Research Email Alert Subscription

Research alerts keep you updated on our latest research publications. Simply enter your contact information, choose the research alerts you would like to receive and click Subscribe. Alerts will be sent as research is published.

We respect your privacy. We will never share or sell your information.

Thank You

We appreciate your interest in Marquette Associates.

If you have questions or need further information, please contact us directly and we will respond to your inquiry within 24 hours.

Contact Us >