Recession Redefined

August 03, 2022 | James Torgerson, Senior Research Analyst

Combination column and line chart showing U.S. GDP Growth, year over year, and Personal Consumer Expenditures (PCE) contribution to GDP. Chart subtitle: In only the mildest recession over the last 50 years did PCE not turn negative. Chart visual description: Y-axis spans percentages from -15% to +15%. X-axis shows dates from 1Q1970 to 1Q2021, though data is through 2Q2022. Recessionary periods are shaded in light grey, with 8 marked in the time period shown. Green columns display Real GDP YoY. Teal line displays PCE Contribution to GDP. A note on the chart notes that data during 2020 exceeds the bounds of the chart area, as the PCE line went negative to -24.1% in 2Q20, and positive to +25.5% in 3Q20. Chart data description: As explained in the text, one common definition of a recession is at least two consecutive quarters of negative GDP growth, and the GDP columns coincide with each recessionary period, going negative a two quarters before a recession, then going positive, then fully falling within the recession shading. The first two quarters of 2022 both had negative GDP YoY. The PCE line also corresponds to the text’s explanation. Though the recent quarters have seen a slight decrease, PCE is still positive as of now. Historically, however, it has turned negative preceding recessions, except for 1991’s. Chart Source: U.S. Bureau of Economic Analysis as of June 30, 2022.

The National Bureau of Economic Research (NBER) is widely considered the official judge on what is and is not a recession. The academic organization’s traditional definition of a recession is a “significant decline in economic activity that is spread across the economy and lasts more than a few months.” This definition can be subjective and, to help avoid the need for revisions, the committee does not typically call the start of a recession, or the end of a recession, until well after the fact.

Another commonly accepted definition of a recession is at least two consecutive quarters of negative GDP growth. Given the last two GDP prints of -1.6% in the first quarter and the advance estimate of -0.9% in the second quarter, the U.S. economy would be in a technical recession. Recently, both the White House and Federal Reserve Chairman Jerome Powell have argued that this interpretation does not accurately reflect the current state of our economy, specifically given the still-strong labor market.

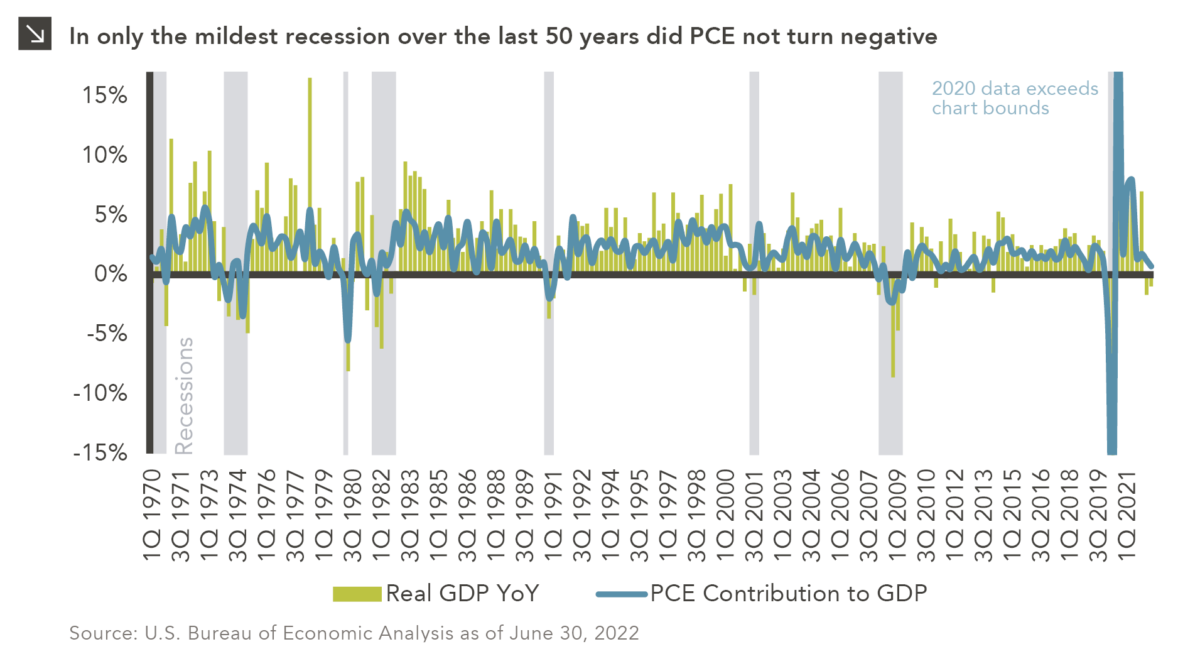
Another economic indicator to consider is consumer spending, specifically the contribution to GDP from Personal Consumption Expenditures (PCE). Consumer spending comprises 70% of GDP and is traditionally a much less volatile component than investment and net exports, the primary contributors to the year-over-year declines in the first half of the year. The strength of the U.S. consumer will dictate the country’s path from here, as healthy balance sheets and a hot labor market contend with decades-high inflation and rising rates. PCE contributed a positive 1.2% and 0.7% to first and second quarter GDP, respectively. In only one of the last eight recessions over the last 50 years — the relatively mild downturn in 2001 — has PCE not turned negative. One month into the third quarter, the highly-regarded Atlanta Fed GDPNow tracker is projecting positive PCE and overall GDP growth for the quarter. The current macro situation is complex, with a healthy U.S. consumer facing a number of headwinds, and, in this case, understanding those underlying dynamics is just as important as the “are we or aren’t we” debate.

Print PDF > Recession Redefined


The opinions expressed herein are those of Marquette Associates, Inc. (“Marquette”), and are subject to change without notice. This material is not financial advice or an offer to purchase or sell any product. Marquette reserves the right to modify its current investment strategies and techniques based on changing market dynamics or client needs.

James Torgerson
Senior Research Analyst

Get to Know James

The opinions expressed herein are those of Marquette Associates, Inc. (“Marquette”), and are subject to change without notice. This material is not financial advice or an offer to purchase or sell any product. Marquette reserves the right to modify its current investment strategies and techniques based on changing market dynamics or client needs.

Related Content

Combination column and line chart showing increase in non-renewables and renewables in net installed capacity (GW) in columns and share of new electricity generating capacity by renewables (line) annually since 2005. Renewables ave seen a marked increase in recent years (183.95GW in 2019 to 691.94GW in 2025). Renewable Share was at 86% for 2025. For full dataset, please contact marquettemarketing@marquetteassociates.com.

05.11.2026

A Renewed Focus on Renewables

In addition to the humanitarian toll of the conflict in Iran, the world is currently confronting the impact that trade…

05.07.2026

The Fed Tackles Succession Planning

The leadership structure of the Federal Reserve is intentionally designed to promote continuity, independence, and institutional stability across political cycles….

Stacked column chart showing Weight in S&P 500 Index in 1985, 1995, 2005, 2015, and 2025 for top 10 companies at that time, with companies stacked for each year by weight. From 1985-2015, top 10 weight ranged from 17.6% to 21.1%, but 2025's weight was 40.6%. Company makeup changes over time, with no companies from 1985/1995 categories in 2025. For full dataset, please contact marquettemarketing@marquetteassociates.com.

05.04.2026

This Too Shall Reconstitute

Rooted in medieval Persian Sufi thought, the adage “this too shall pass” speaks to the fleeting and impermanent nature of…

Three-line chart comparing cumulative returns for MSCI EM Latin America Index, MSCI EAFE Index, and S&P 500 Index, Jan 1, 2026 through April 24, 2026. Dashed line at February 28 demarcates U.S. strikes on Iran. While all three indices dipped after war began, Latin America Index was higher to begin with and remains high. Most recent data point (4/24) for Latin America is 20.36%, EAFE is 5.7%, and S&P 500 is 5.06%. For full dataset, please email marquettemarketing@marquetteassociates.com.

04.27.2026

Let’s Hear It for Latin America

Latin American equity markets have shown remarkable strength in 2026. After a strong start to the year, the MSCI Emerging…

04.23.2026

We’ve Seen This Before

Diversify. Rebalance. Stay invested. Every one of these letters has concluded with that same advice in some shape or form….

Two-line chart showing unemployment rate for All U.S. Workers and Recent College Graduates (Ages 22–27), 12/31/05 to 12/31/25. Up to 2020 period, Recent College Graduates generally had a lower unemployment rate than all U.S. workers category, but since then, the opposite has been true. Lines begin at ~3% to ~5% range in 2005, rose during Global Financial Crisis of '07-'09 to near 10% for All, ~7% for Grads, then both lines declined fairly steadily up to COVID. Peak for both series was 6/30/20, with All at 12.8% and Grads at 13.4%. Most recent data for 12/31/25 is ~4% for All and ~5.5% for Grads. For full dataset, please email marquettemarketing@marquetteassociates.com.

04.20.2026

The Sorrows of Young Workers

Entry-level jobs have traditionally served as the primary bridge between education and stable employment, offering young workers a foothold from…

More articles

Subscribe to Research Email Alerts

Research Email Alert Subscription

Research alerts keep you updated on our latest research publications. Simply enter your contact information, choose the research alerts you would like to receive and click Subscribe. Alerts will be sent as research is published.

We respect your privacy. We will never share or sell your information.

Thank You

We appreciate your interest in Marquette Associates.

If you have questions or need further information, please contact us directly and we will respond to your inquiry within 24 hours.

Contact Us >