10.08.2026
3Q 2026 Market Insights
This video is a recording of a live webinar held October 22 by Marquette’s research team analyzing the third quarter…


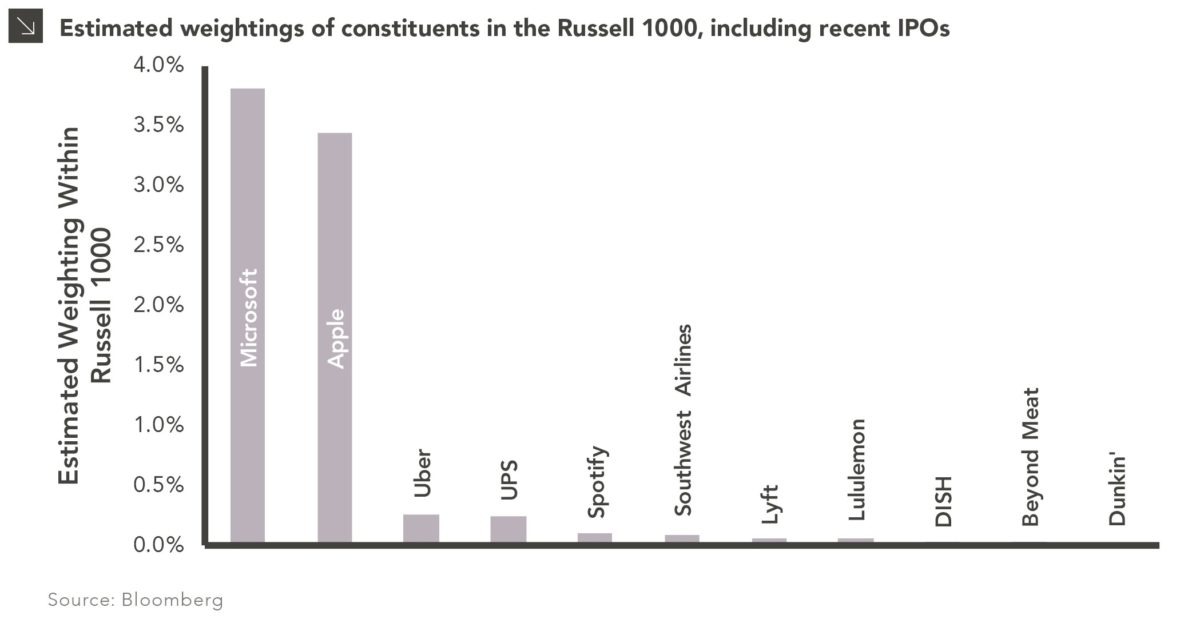
It’s that time of year again! The end of June brings longer summer days and the annual Russell index reconstitution. The Russell 1000’s constituent rebalancing this month also brings the inclusion of a few recent high-profile IPOs, most notably Uber, Lyft, Spotify, and Beyond Meat. This means all investors holding a passive allocation to the Russell 1000 will soon hold shares in these companies.
The Russell’s methodology weights constituent allocations based on the free-float market cap, which only includes shares readily available to trade. We show here estimated weightings of these newly IPO’d constituents alongside some well-known peers of similar weights. Notably, Microsoft has overtaken Apple as the largest index constituent. Uber, while likely the largest IPO of 2019, is still dwarfed by these two behemoths and will ultimately not become a massive component of the index’s roughly 1,000 constituents. Similarly, while the top few constituents seem to hold outsized portions of the index, the index’s performance is not dictated solely by them as they are significantly outnumbered by over 900 names which contribute to performance.
Print PDF > Russell Indices Incorporate “Uber” Exciting IPOs
The opinions expressed herein are those of Marquette Associates, Inc. (“Marquette”), and are subject to change without notice. This material is not financial advice or an offer to purchase or sell any product. Marquette reserves the right to modify its current investment strategies and techniques based on changing market dynamics or client needs.
The opinions expressed herein are those of Marquette Associates, Inc. (“Marquette”), and are subject to change without notice. This material is not financial advice or an offer to purchase or sell any product. Marquette reserves the right to modify its current investment strategies and techniques based on changing market dynamics or client needs.

10.08.2026
This video is a recording of a live webinar held October 22 by Marquette’s research team analyzing the third quarter…

10.22.2026
Anyone who has run a marathon knows the last six miles are brutal — no matter how well the first…

10.19.2026
Since 1980, the S&P 500 Index has generally performed well in the weeks surrounding U.S. midterm elections. Specifically, the index…

10.12.2026
This week’s chart highlights the accelerating growth of electricity demand in the U.S., which has been driven primarily by the…

10.05.2026
For investors, the spookiest thing about October might not be the ghosts and monsters that are bound to show up…

09.28.2026
The phrase “expectations of higher inflation” has become a staple in financial news to explain the increase in nominal U.S….
Research alerts keep you updated on our latest research publications. Simply enter your contact information, choose the research alerts you would like to receive and click Subscribe. Alerts will be sent as research is published.
We respect your privacy. We will never share or sell your information.
If you have questions or need further information, please contact us directly and we will respond to your inquiry within 24 hours.
Contact Us >