Chad Sheaffer, CFA, CAIA
Associate Director of Private Credit


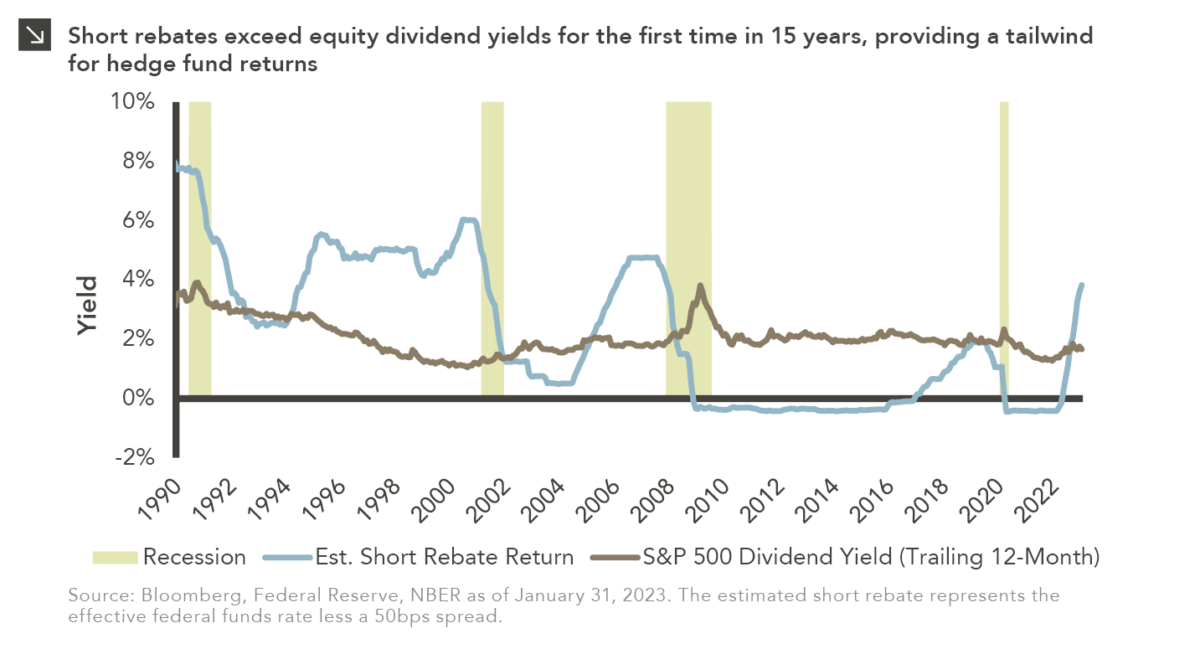
Investor focus over the last year has centered on the Federal Reserve and rising interest rates. Since March 2022, the federal funds rate has increased 450 basis points, with further rate hikes expected in the next six months. While the Fed’s intent is to lower inflation and create price stability, higher rates have widespread implications for the economy and markets. While many have focused on the challenges for investors, hedge funds, particularly those that have the ability to short stocks and bonds, are also set to benefit from the increase in rates.
To establish a short position, a hedge fund must first borrow the security from other asset owners, providing cash collateral to the security lender to protect against potential default. During the borrowing period, the hedge fund that borrowed the stock must pay the lender any dividends or interest received, but is also entitled to receive back any interest that accrues on the required collateral. The return earned on the collateral, known as the short rebate or stock loan rebate, can meaningfully contribute to a hedge fund’s return, particularly for funds with meaningful short portfolio allocations.
For the past 15 years, the short rebate, estimated as the federal funds rate less a fee charged for borrowing a security (typically between 25 and 75 basis points), had been less than the dividend yield on the S&P 500, equating to a headwind to returns for short sellers. However, with short rebates now firmly in positive territory, hedge funds can benefit from higher expected returns in a segment of their portfolio that has been challenged since the Global Financial Crisis. While overall hedge fund returns will still be dependent on manager security selection and exposure management, the short rebate flipping from a headwind to a tailwind is just one of the reasons that the go-forward environment should be more favorable than it has been for relative hedge fund outperformance.
Print PDF > The Short Rebate: A Headwind Becomes a Tailwind

The opinions expressed herein are those of Marquette Associates, Inc. (“Marquette”), and are subject to change without notice. This material is not financial advice or an offer to purchase or sell any product. Marquette reserves the right to modify its current investment strategies and techniques based on changing market dynamics or client needs.

10.12.2026
This week’s chart highlights the accelerating growth of electricity demand in the U.S., which has been driven primarily by the…

10.08.2026
LIVE WEBINAR — OCTOBER 22 Please join Marquette’s research team for our 3Q 2026 Market Insights Webinar…

10.05.2026
For investors, the spookiest thing about October might not be the ghosts and monsters that are bound to show up…

09.28.2026
The phrase “expectations of higher inflation” has become a staple in financial news to explain the increase in nominal U.S….

09.21.2026
For much of the past several years, the conventional view has been that higher interest rates and stretched valuations would…

09.14.2026
There are many great things about working at Marquette Associates, but “Free Lunch Tuesday” is right at the top of…
Research alerts keep you updated on our latest research publications. Simply enter your contact information, choose the research alerts you would like to receive and click Subscribe. Alerts will be sent as research is published.
We respect your privacy. We will never share or sell your information.
If you have questions or need further information, please contact us directly and we will respond to your inquiry within 24 hours.
Contact Us >