07.22.2026
Under the Radar for the Second Half
The usual midyear version of these letters has touched on year-to-date performance as well as the most influential macroeconomic and…
After eight post-recession Fed rate hikes since 2015, the U.S. Treasury yield curve continues to flatten. On Monday, December 3, the yield curve inverted by one basis point between the three-year yield at 2.84% and the five-year yield at 2.83%. The next day, that inversion intensified to two basis points, with the three-year yield at 2.81% and the five-year yield at 2.79%, causing an 800-point correction in the Dow. The bellwether steepness indicator — the difference between the two-year yield and 10-year yield — remains upward sloping, however, but narrowed from 15bp on Monday with the two-year at 2.83% and 10-year at 2.98% to 11bp on Tuesday with the two-year at 2.80% and 10-year at 2.91%.
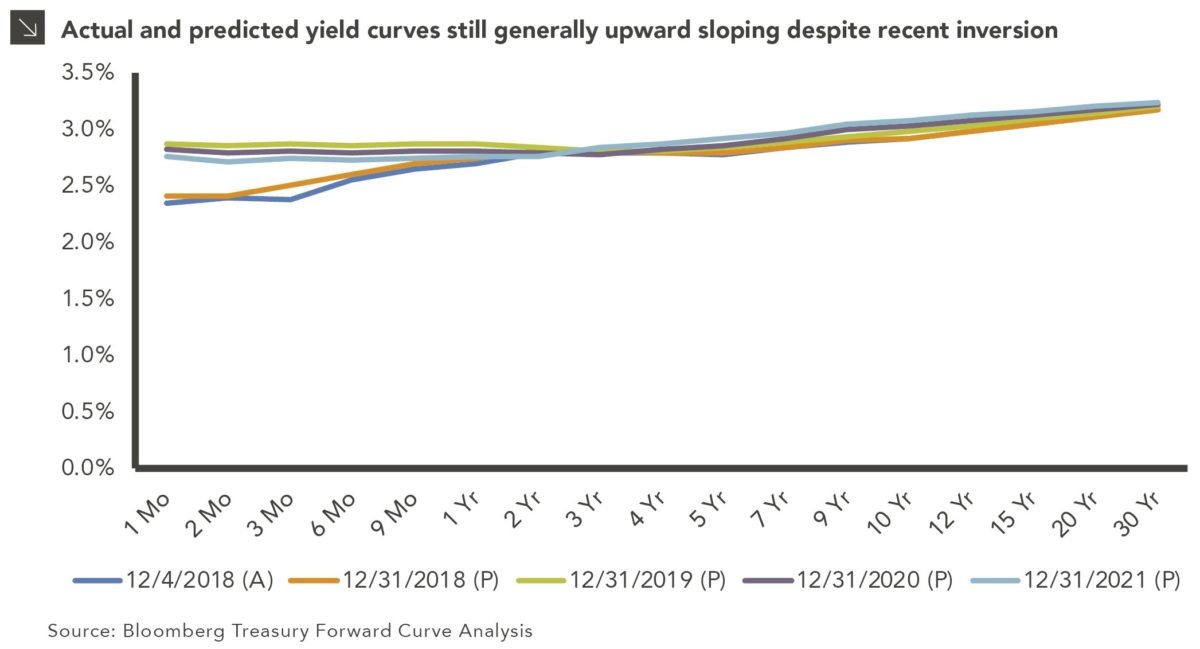
Based on previous market cycles, an inverted yield curve has predicted a recession six months to two years after inversion. Prior to the 2008 crisis, the first sign of inversion occurred in the 4th quarter of 2005, when the three-year and five-year inverted first, followed by the two- and ten-year inverting in the same quarter, roughly two years before the crisis that began in early 2008. This week’s chart shows the actual yield curve at the end of the day on December 4, along with the predicted yield curve at the end of this year and the next three years based on Treasury forwards. We can see that the market expects the curve to be generally upward sloping for the rest of this year, but to further invert in the front of the curve to the belly, and remain inverted in that region, for the next three years. However, the market still shows the 10s minus 2s to be upward sloping, even in the outer years.
Over the last few quarters, the expectations for the Fed’s hikes declined from one this December plus four more in 2019 to one this December plus only one more in June 2019. With this first sign of inversion, the Fed may pause on a hike for December, but it has communicated the hike so much that it may have to move forward with it or risk a loss of credibility. As 2018 heads to a close, this recent inversion bears watching and will no doubt have an impact on this month’s as well as next year’s capital markets.
The opinions expressed herein are those of Marquette Associates, Inc. (“Marquette”), and are subject to change without notice. This material is not financial advice or an offer to purchase or sell any product. Marquette reserves the right to modify its current investment strategies and techniques based on changing market dynamics or client needs.
The opinions expressed herein are those of Marquette Associates, Inc. (“Marquette”), and are subject to change without notice. This material is not financial advice or an offer to purchase or sell any product. Marquette reserves the right to modify its current investment strategies and techniques based on changing market dynamics or client needs.
07.22.2026
The usual midyear version of these letters has touched on year-to-date performance as well as the most influential macroeconomic and…

07.20.2026
Our most recent Chart of the Week publication discussed how the AI investment opportunity has expanded beyond…

07.13.2026
One of the enduring lessons of the California Gold Rush is that the greatest fortunes were often made not by…

07.07.2026
JULY 23 — 1:00pm CT Please join Marquette’s research team for our 2026 Halftime Market Insights Webinar…

07.06.2026
Since traditional exit routes have remained constrained in recent years due to higher interest rates, valuation gaps, and a subdued…

06.29.2026
This week’s chart highlights the varying return profiles across key infrastructure sectors by illustrating the split between income and capital…
Research alerts keep you updated on our latest research publications. Simply enter your contact information, choose the research alerts you would like to receive and click Subscribe. Alerts will be sent as research is published.
We respect your privacy. We will never share or sell your information.
If you have questions or need further information, please contact us directly and we will respond to your inquiry within 24 hours.
Contact Us >