Thomas Neuhardt
Associate Research Analyst
Get to Know Thomas
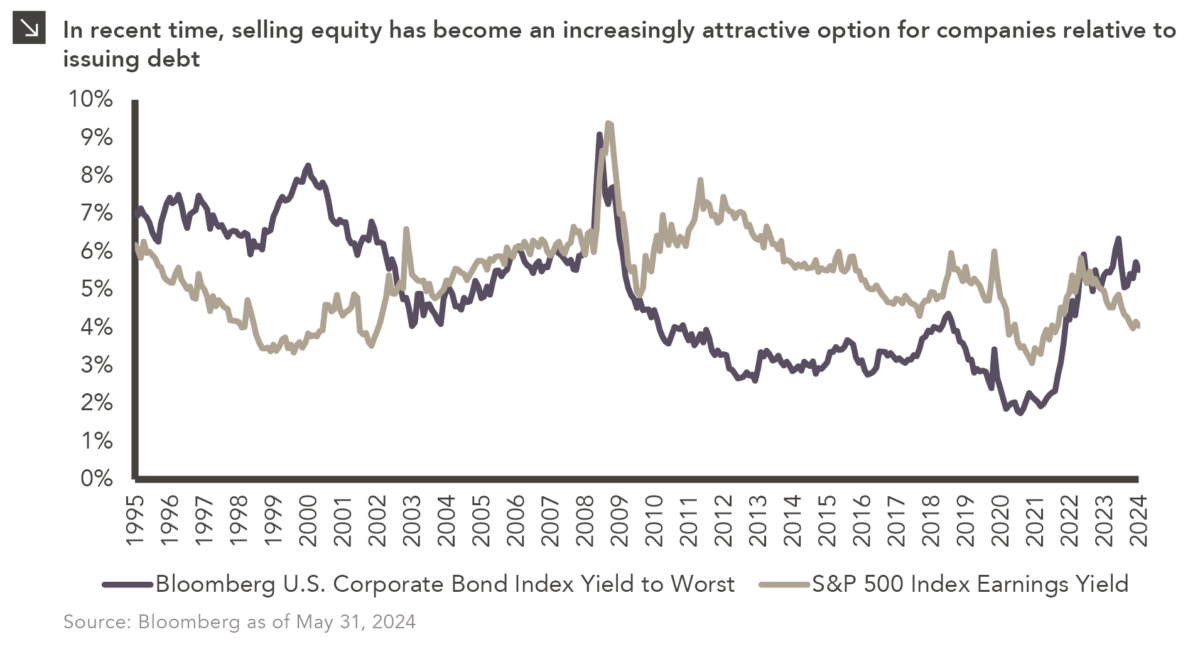
In the years following the Global Financial Crisis, issuing new debt was an easy decision for companies looking to raise capital given an environment of historically low interest rates. That said, decisions related to the composition of corporate capital structures are now less straightforward due to seismic shifts in monetary policy that have taken place in recent time. To that point, this week’s chart compares the yield-to-worst of the Bloomberg U.S. Corporate Bond Index, a proxy for the cost of debt, to the earnings yield of the S&P 500 Index. The earnings yield is calculated by dividing earnings-per-share by the price of the index and is used as a proxy to determine the costs companies face when it comes to new equity share issuance (i.e., the lower the earnings yield, the cheaper it is to sell shares and vice versa). As readers can observe in the chart above, this yield now sits below the yield-to-worst of the fixed income index.
Companies generally prefer issuing debt over equity due to the tax shield associated with this financing (i.e., interest expenses are typically tax-deductible), which still renders debt the more cost-efficient option for many companies in the current environment. Further, equity issuance is often viewed negatively by market participants due to the dilution of per-share earnings that arises as a result. There are, of course, additional factors beyond the costs of debt and equity that CFOs must consider when making decisions related to capital structure dynamics. That said, in light of the trends outlined above, many companies may begin to view equity issuance as a more attractive option when it comes to raising capital.
Print PDF
The opinions expressed herein are those of Marquette Associates, Inc. (“Marquette”), and are subject to change without notice. This material is not financial advice or an offer to purchase or sell any product. Marquette reserves the right to modify its current investment strategies and techniques based on changing market dynamics or client needs.

07.24.2026
This video is a recording of a live webinar held July 23 by Marquette’s research team analyzing the first half…
07.22.2026
The usual midyear version of these letters has touched on year-to-date performance as well as the most influential macroeconomic and…

07.20.2026
Our most recent Chart of the Week publication discussed how the AI investment opportunity has expanded beyond…

07.13.2026
One of the enduring lessons of the California Gold Rush is that the greatest fortunes were often made not by…

07.06.2026
Since traditional exit routes have remained constrained in recent years due to higher interest rates, valuation gaps, and a subdued…

06.29.2026
This week’s chart highlights the varying return profiles across key infrastructure sectors by illustrating the split between income and capital…
Research alerts keep you updated on our latest research publications. Simply enter your contact information, choose the research alerts you would like to receive and click Subscribe. Alerts will be sent as research is published.
We respect your privacy. We will never share or sell your information.
If you have questions or need further information, please contact us directly and we will respond to your inquiry within 24 hours.
Contact Us >