Jesus Jimenez
Partner


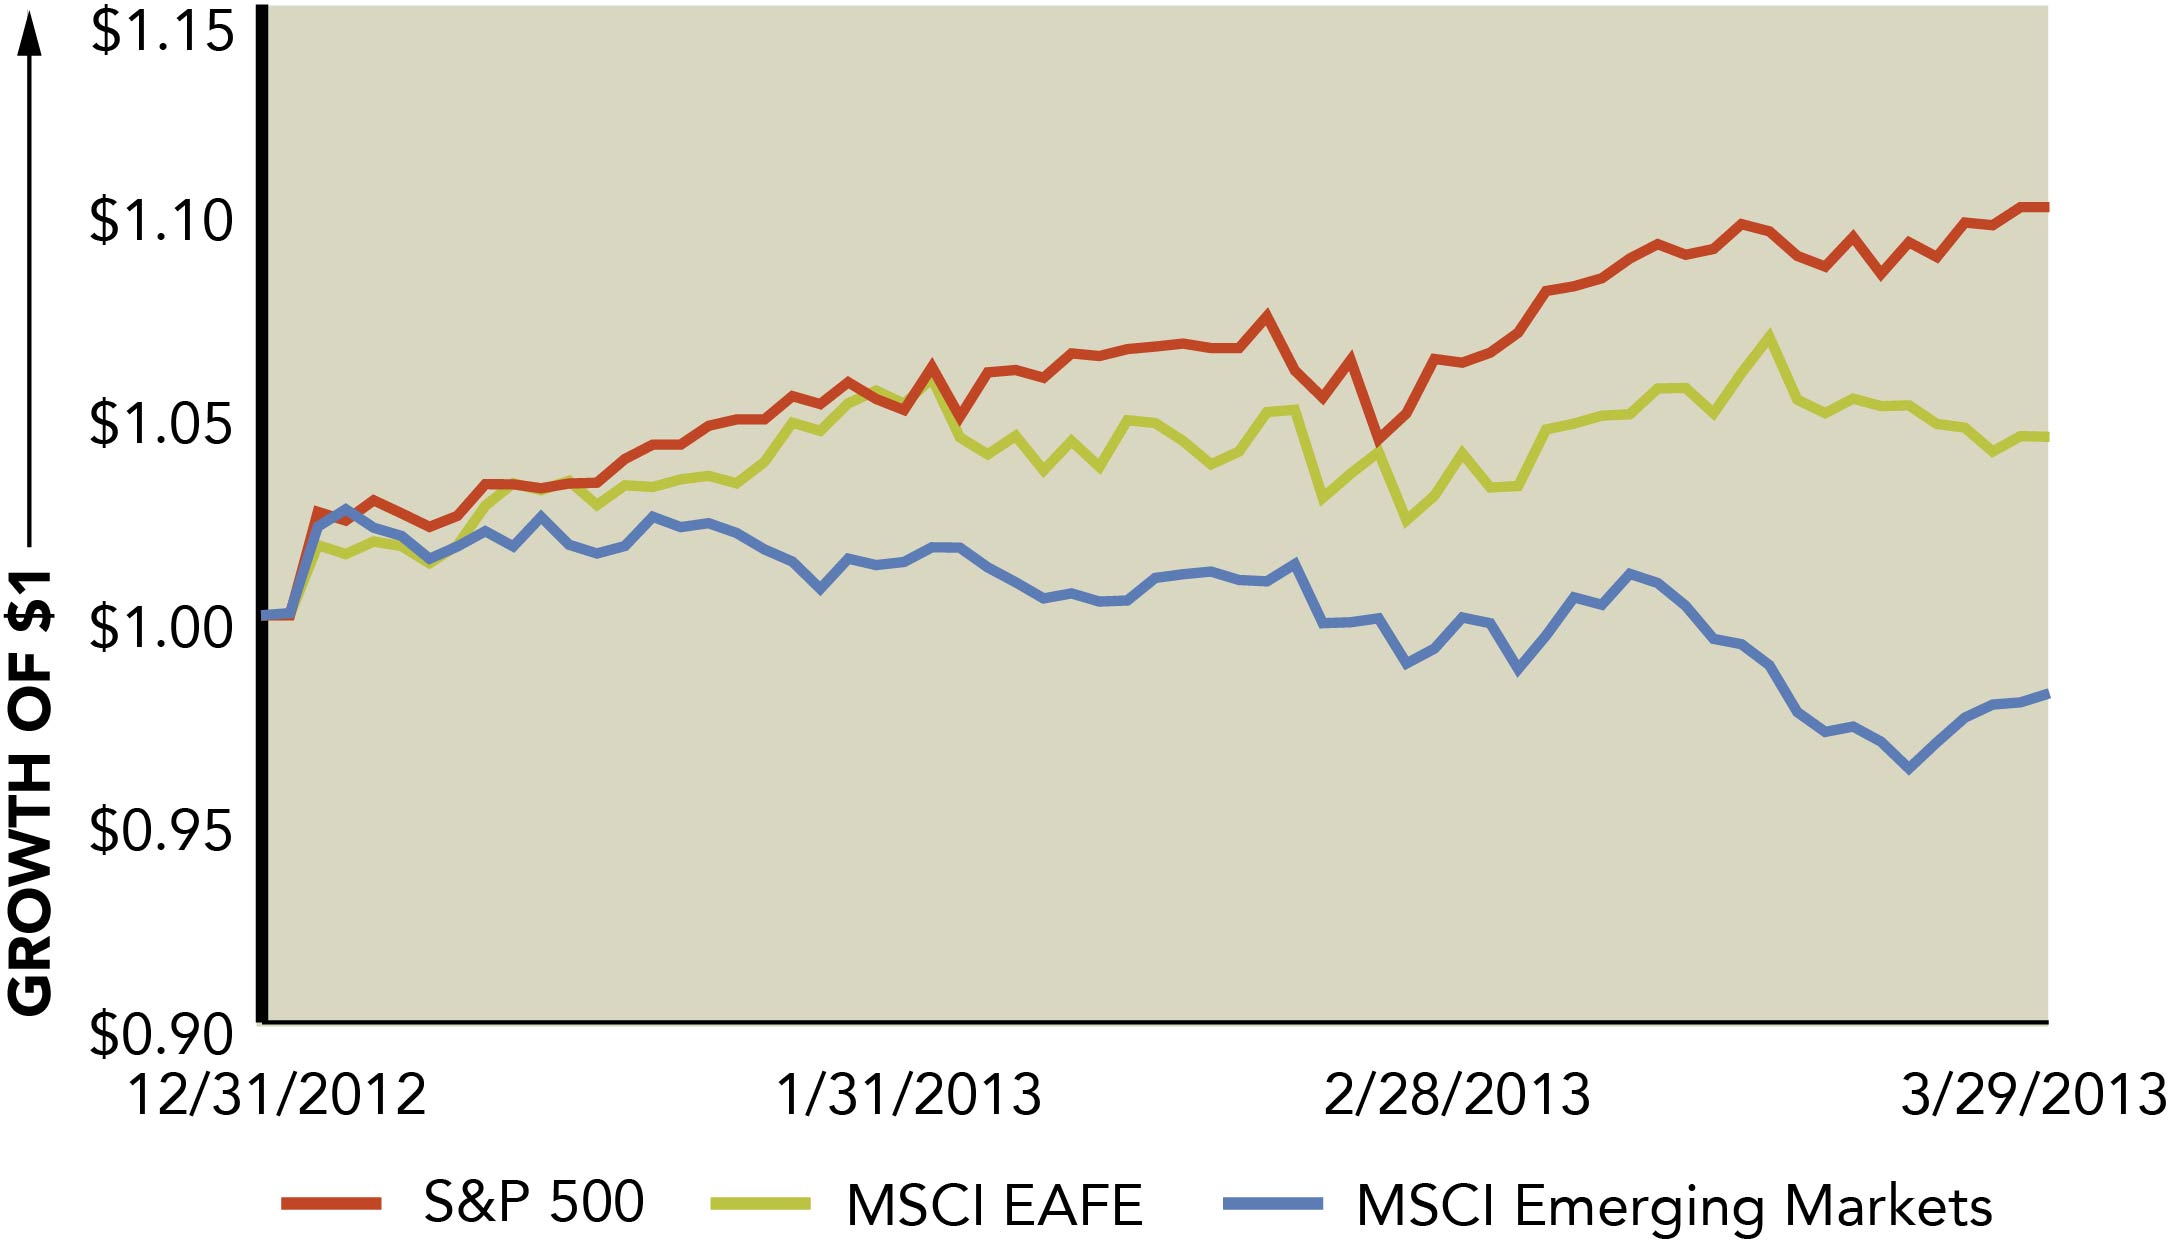
This week’s Chart of the Week examines the relative performance of equity markets from a global perspective. Since January 1, 2013, U.S. large-cap stocks have returned a cumulative 10.03%, international large-cap stocks have returned a cumulative 4.38% and emerging market stocks have returned a disappointing -1.92% through March 31, 2013.
Many factors can be attributed to the underperformance of emerging markets including countries’ management of their monetary policies. With slowing global demand and inflationary pressure taking a toll on emerging markets, countries have been forced to adjust their monetary policies. Brazil has increased interest rates to combat inflation, which has impacted the Brazilian Real. More generally, a combination of slowing demand for their products and rising inflation has weakened the export market for emerging market countries. In contrast, Japan’s recent activity to devalue the Yen had made its exports significantly more attractive, thus boosting its competitiveness, a move that has benefitted returns for the MSCI EAFE index.
Currently, emerging markets trade at a price-to-earnings ratio of 12 compared to 15 for U.S. large-cap stocks. This favorable valuation level relative to U.S. stocks combined with superior long–term growth prospects continue to make emerging market stocks an attractive investment option, despite recent market struggles.

The opinions expressed herein are those of Marquette Associates, Inc. (“Marquette”), and are subject to change without notice. This material is not financial advice or an offer to purchase or sell any product. Marquette reserves the right to modify its current investment strategies and techniques based on changing market dynamics or client needs.

10.12.2026
This week’s chart highlights the accelerating growth of electricity demand in the U.S., which has been driven primarily by the…

10.05.2026
For investors, the spookiest thing about October might not be the ghosts and monsters that are bound to show up…

09.28.2026
The phrase “expectations of higher inflation” has become a staple in financial news to explain the increase in nominal U.S….

09.21.2026
For much of the past several years, the conventional view has been that higher interest rates and stretched valuations would…

09.14.2026
There are many great things about working at Marquette Associates, but “Free Lunch Tuesday” is right at the top of…

09.08.2026
Over the last several years, emerging market debt (EMD) has faced several headwinds, with rising yields across other fixed income…
Research alerts keep you updated on our latest research publications. Simply enter your contact information, choose the research alerts you would like to receive and click Subscribe. Alerts will be sent as research is published.
We respect your privacy. We will never share or sell your information.
If you have questions or need further information, please contact us directly and we will respond to your inquiry within 24 hours.
Contact Us >