07.24.2026
2026 Halftime Market Insights
This video is a recording of a live webinar held July 23 by Marquette’s research team analyzing the first half…
The strength of the U.S. economy over the last several quarters has surprised many investors, as consensus expectations from the recent past called for a recession due to rapid monetary tightening by the Federal Reserve. That said, consumer spending actually increased in 2023, and the labor market remained mostly strong as well. This divergence between the expected and realized impacts of higher interest rates has led many to look more closely at the channels through which monetary policy is connected to consumers. To that point, this week’s chart highlights one structural trend that has been shielding many U.S. households from the impact of higher interest rates.
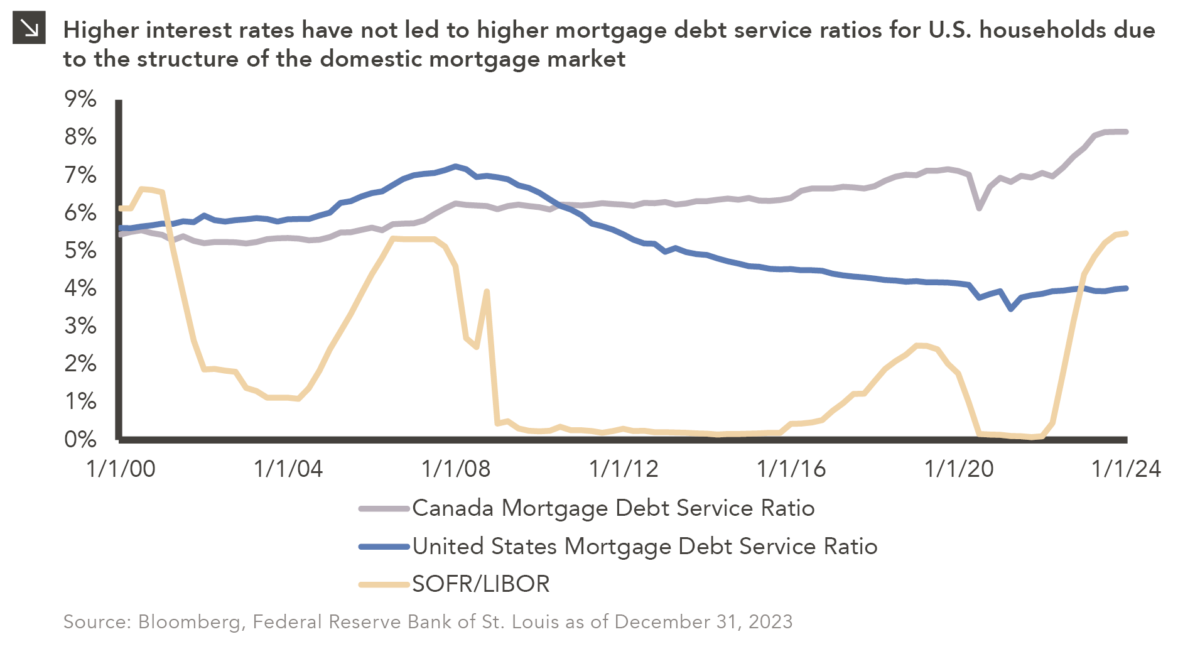
Monthly mortgage payments and outstanding mortgage debt are often among the largest liabilities on the household balance sheets of the more than 60% of Americans who have mortgages. In the period following the Global Financial Crisis through the beginning of the most recent hiking cycle, long-term fixed-rate mortgages dominated the residential mortgage market in the U.S., making up more than 90% of originations in 13 out of the last 14 calendar years. As a result, many households have locked in relatively low long-term fixed rates on mortgage debt. As of the end of last year, the effective rate on outstanding mortgage debt in the U.S. was roughly 3.8%, while the market rate for a new 30-year fixed-rate mortgage was just below 7.0%. While this spread between new and existing mortgage rates has adversely impacted an already strained supply of housing and led to higher home prices, it has also stymied the housing channel of monetary policy transmission. Said another way, the high percentage of fixed-rate mortgages in the U.S. cushions consumers from Federal Reserve interest rate increases and, thus, limits the effectiveness of Fed policy. This is exemplified by the fact that the effective rate on outstanding domestic mortgage debt has only increased from around 3.3% to 4.0% during the current hiking cycle.
As a result of these dynamics, the U.S. household mortgage debt service ratio — which is the ratio of monthly mortgage principal and interest payments to disposable household income — has remained low, so more disposable income is available to Americans relative to individuals in other parts of the developed world. Indeed, the ability to lock in fixed rates on mortgage loans at terms of 20 or 30 years is somewhat unique to the United States in a way that is often overlooked. Canadian households, for instance, are already feeling pain from higher interest rates, evidenced by the recent increase in the nation’s mortgage debt service ratio relative to that of the U.S. To that point, Canada has shorter available mortgage terms from traditional lenders, with a maximum of five years prior to refinancing in most cases. This has left many Canadians grappling with the impact of higher rates, as most possess either fixed-rate mortgages with short-term resets or those with variable rates.
As the conversation over explanations for the surprising strength of the U.S. consumer continues, the characteristics of the domestic mortgage market are important to take into consideration. Indeed, higher interest rates have allowed many domestic households to benefit from an increased rate on assets while continuing to pay a low fixed rate on significant liabilities.
Print PDFThe opinions expressed herein are those of Marquette Associates, Inc. (“Marquette”), and are subject to change without notice. This material is not financial advice or an offer to purchase or sell any product. Marquette reserves the right to modify its current investment strategies and techniques based on changing market dynamics or client needs.

07.24.2026
This video is a recording of a live webinar held July 23 by Marquette’s research team analyzing the first half…
07.22.2026
The usual midyear version of these letters has touched on year-to-date performance as well as the most influential macroeconomic and…

07.20.2026
Our most recent Chart of the Week publication discussed how the AI investment opportunity has expanded beyond…

07.13.2026
One of the enduring lessons of the California Gold Rush is that the greatest fortunes were often made not by…

07.06.2026
Since traditional exit routes have remained constrained in recent years due to higher interest rates, valuation gaps, and a subdued…

06.29.2026
This week’s chart highlights the varying return profiles across key infrastructure sectors by illustrating the split between income and capital…
Research alerts keep you updated on our latest research publications. Simply enter your contact information, choose the research alerts you would like to receive and click Subscribe. Alerts will be sent as research is published.
We respect your privacy. We will never share or sell your information.
If you have questions or need further information, please contact us directly and we will respond to your inquiry within 24 hours.
Contact Us >