07.24.2026
2026 Halftime Market Insights
This video is a recording of a live webinar held July 23 by Marquette’s research team analyzing the first half…
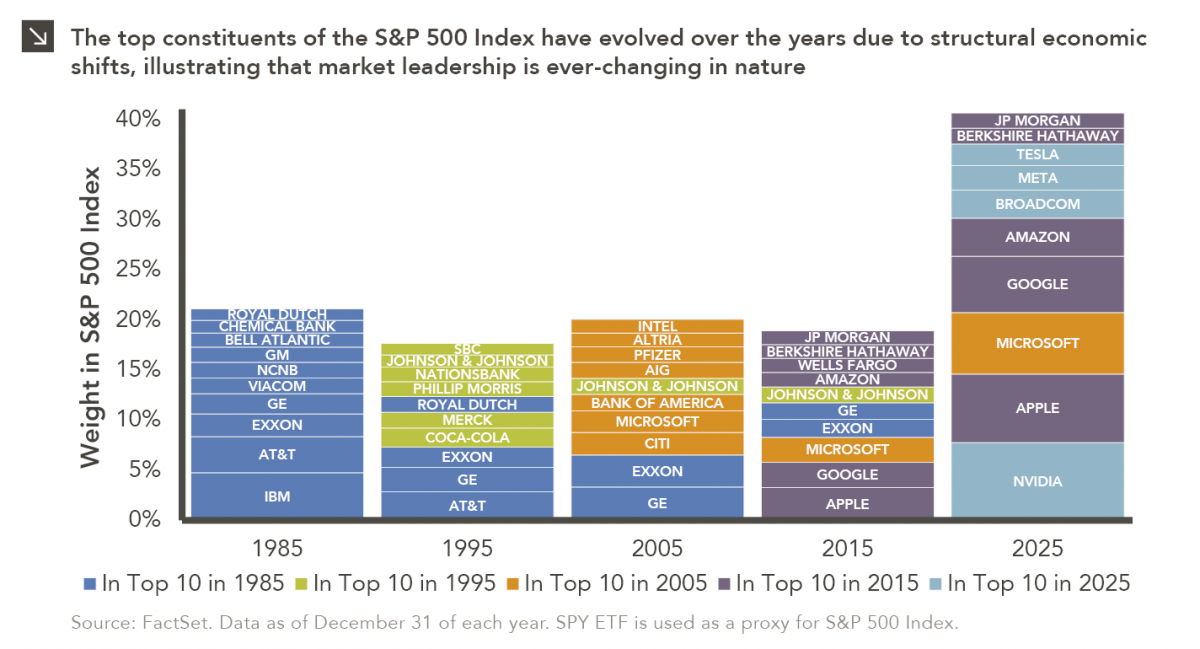
2018 Investment Symposium flash talk by Samantha T. Grant, CFA, CAIA
Since the 2008 financial crisis, investors have flocked to new and innovative growth stocks over more traditional and seemingly boring value stocks. This is not the first time investors have favored growth over value, and surely it will not be the last. In this session, we will discuss what makes the current growth cycle different from previous growth cycles, the companies at the forefront of the technology wave and what could cause the market to reverse course and favor value over growth.
A summary of this flash talk can be downloaded here.
The opinions expressed herein are those of Marquette Associates, Inc. (“Marquette”), and are subject to change without notice. This material is not financial advice or an offer to purchase or sell any product. Marquette reserves the right to modify its current investment strategies and techniques based on changing market dynamics or client needs.

07.24.2026
This video is a recording of a live webinar held July 23 by Marquette’s research team analyzing the first half…
07.22.2026
The usual midyear version of these letters has touched on year-to-date performance as well as the most influential macroeconomic and…

07.20.2026
Our most recent Chart of the Week publication discussed how the AI investment opportunity has expanded beyond…

07.13.2026
One of the enduring lessons of the California Gold Rush is that the greatest fortunes were often made not by…

05.26.2026
The classic novel A Tale of Two Cities by Charles Dickens begins with the line “It was the best of…
05.04.2026
Rooted in medieval Persian Sufi thought, the adage “this too shall pass” speaks to the fleeting and impermanent nature of…
Research alerts keep you updated on our latest research publications. Simply enter your contact information, choose the research alerts you would like to receive and click Subscribe. Alerts will be sent as research is published.
We respect your privacy. We will never share or sell your information.
If you have questions or need further information, please contact us directly and we will respond to your inquiry within 24 hours.
Contact Us >