Commodities represent a unique asset class within global financial markets. Like equities and bonds, commodity prices are influenced by the macroeconomic environment, geopolitical events, and technological developments. However, because commodities are tangible assets, their prices are also directly affected by physical supply-and-demand dynamics, weather patterns, and other factors unique to underlying resource markets. Recent structural trends, including rising demand for metals within the technology and renewable energy sectors, have created secular tailwinds for certain commodities that potentially complement the asset class’s traditionally cyclical characteristics. Additionally, evolving energy market dynamics may provide further structural support. Years of underinvestment in conventional energy production coupled with recent geopolitical conflicts and damage to critical infrastructure in the Middle East have increased concerns about the long-term resilience of global energy supply chains, potentially supporting elevated energy prices relative to historical norms. Simultaneously, global inflationary pressures and conflicts across the world have renewed interest in commodity allocations as a hedge against macroeconomic uncertainty and geopolitical strife. This paper examines the viability of commodities in institutional portfolios by exploring the dynamics of commodity cycles and demand drivers, analyzing the historical performance of the asset class, and outlining risk management considerations. By reviewing both opportunities and challenges, the paper aims to provide a balanced and educational assessment for institutional investors seeking to understand the role of commodities in modern portfolios.
Topic Tags: Asset Allocation
Healthcare System Operating Portfolios: Balancing Stability with Need for Growth
Healthcare systems have faced an onslaught of challenges in recent years. They had to navigate the operational and financial headwinds stemming from COVID-19, a severe labor shortage, and 2022’s double-digit drawdowns in both stocks and bonds. Since the end of 2022, global equity markets have returned more than 70% cumulatively, but a combination of portfolio draws and elevated cash expense growth has left median days cash on hand roughly flat. Going forward, balance sheet liquidity is likely to be restrained. While operating margins are improving, the appetite for capital spending remains high and the effects of the One Big Beautiful Bill Act have yet to emerge. At the same time, equities are expensive and credit spreads are tight, limiting the margin for error. Health systems need to carefully weigh the risks of a significant market decline with the need for long-term growth.
Where Should Investors Land on the Aggregate Continuum?
Contrary to widespread belief, fixed income aggregate strategies offer a continuum of active risk and return profiles. While aggregate strategies broadly aim to provide income, diversification, and liquidity, varying degrees of excess return exist. Investors must choose what suits their active risk and return goals.
Fixed income mandates are described by their beta and benchmarked to a similarly named index. For example, long credit is benchmarked to the Bloomberg Long Credit Index and high yield is benchmarked versus the Bank of America High Yield Master II Index. Once a beta is selected, then an alpha objective is chosen for the mandate. Some mandates in the universe have an alpha target of benchmark plus 50 basis points (bps), while others target an excess return of 100bps or more.
However, this is not true for aggregate strategies. The beta and index are the Bloomberg Aggregate Index. Rather than having different objectives, aggregate mandates have different “asset classes.” The aggregate continuum should not be thought of as different asset classes, but rather different active risk and return profiles.
This white paper outlines considerations for investors when choosing a fixed income aggregate strategy, including an overview of the Bloomberg Aggregate Index, how investment managers can generate active risk, excess return targets, and the important distinction between risk and active risk.
Industrial Real Estate: Smaller is Better?
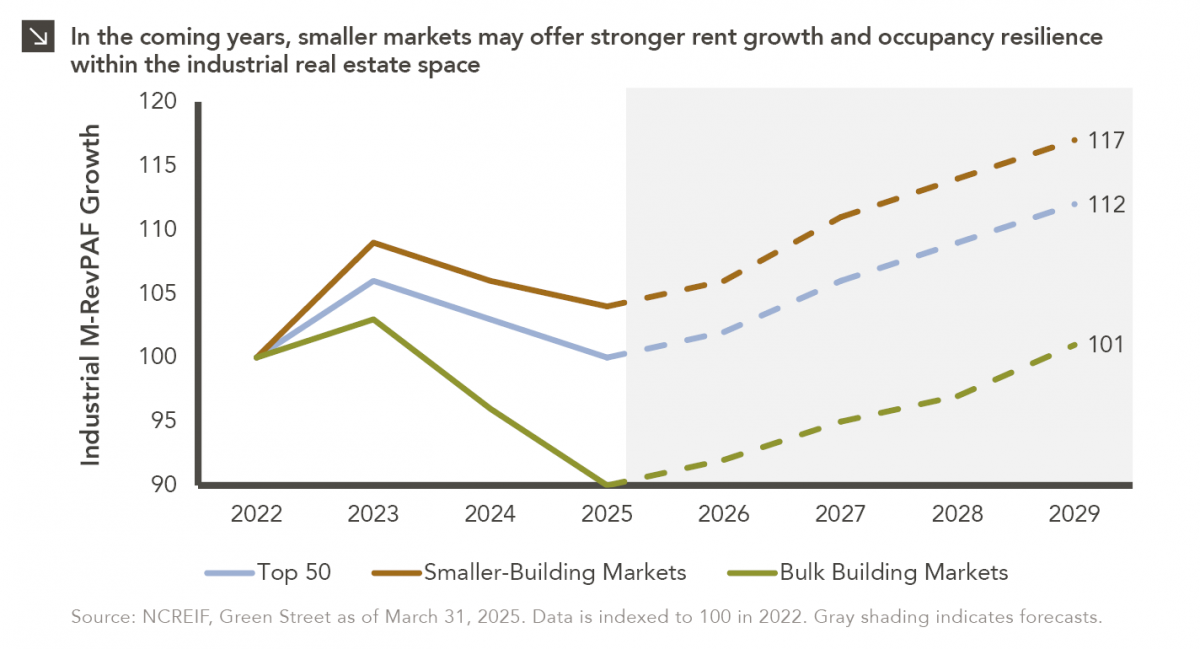
This week’s chart compares realized and expected Market Revenue per Available Foot (“M-RevPAF”) growth within the industrial real estate space across three segments: The top 50 markets, smaller-building markets, and bulk building markets. M-RevPAF blends rent and occupancy into a single metric, providing a comprehensive view of market revenue performance.
Over the past several years, elevated new supply in low-barrier bulk distribution markets has pressured occupancy and rents, causing this segment to lag both smaller-building markets and the Top 50 diversified index. That gap is expected to widen further by 2029, as smaller-building markets are projected to deliver roughly five percentage points of additional cumulative revenue growth relative to bulk markets. For instance, smaller-building markets like those in infill and supply-constrained areas such as South Florida are positioned to capture stronger rent growth and maintain higher occupancy rates due to demand dynamics and limited new deliveries. Conversely, bulk distribution markets are still digesting significant deliveries from the 2021-2023 development cycle, which may keep vacancies elevated and rent growth muted for several years.
These forecasts highlight the potential for a meaningful divergence in performance across industrial subsectors, stressing the need for discipline and precision when it comes to capital allocation by asset managers. Allocations toward smaller markets can help enhance portfolio resilience and capture outperformance relative to bulk distribution markets, where managers should be employing more conservative underwriting (assuming longer lease-up periods, requiring wider exit cap rates to compensate for slower NOI growth, etc.). A diversified approach that combines Top 50 markets with targeted exposures to smaller-building strategies may offer the best balance between growth and stability for investors in the years ahead.
Looking Across the Capital Stack

Despite allocations to various segments of corporate capital structures, most balanced portfolios have a degree of overlap when it comes to sector exposure across equities and fixed income. Still, key differences across the sector exposures of the U.S. equity and corporate bond markets are worth detailing. The extent to which the S&P 500 Index, which serves as a representation of the domestic large-cap stock market, is exposed to the Information Technology space has been described at length, with that sector comprising roughly one-third of the benchmark. This reflects the growth-oriented nature of the equity landscape, which Information Technology and similar sectors (e.g., Communication Services) have dominated due to higher earnings growth and extremely positive sentiment. In contrast, the Bloomberg Investment Grade Corporate Bond Index maintains a 34% weight to the Financials sector, with relatively balanced exposure to spaces like Health Care (11%), Utilities (10%), and Communication Services (7%). This dynamic reflects the capital-intensive nature of these sectors, which are comprised of companies that tend to issue more debt and are considered safer from a credit perspective. Finally, the Bloomberg High Yield Corporate Bond Index is most exposed to the Consumer Discretionary (23%) and Communication Services (15%) spaces, which are more sensitive to economic cycles and, thus, typically offer higher yields to compensate for higher risk.
The varied sector exposures for these indices are reflected in historical return correlation data. On a since-inception basis, the S&P 500 Index has exhibited correlations of 0.40 and 0.63 with the Investment Grade Corporate Bond and High Yield Corporate Bond indices, respectively. These figures suggest that while equities and bonds can move together at times, the asset classes often behave differently. Importantly, these correlations are not static. Rather, they tend to rise during periods of market stress when asset classes often move in tandem due to broad risk-off sentiment. Under normal market conditions, however, the differences in the sector compositions of these indices allow for diversification benefits in a balanced portfolio.
By combining equities with both investment grade and high yield corporate bonds, investors gain exposure to a broader mix of U.S. businesses across sectors and asset classes. This dynamic can help market participants mitigate the impact of sector-specific downturns, making a balanced portfolio more resilient in varying economic environments.
Why Are Emerging Markets Investors Removing Their China Exposure?
Emerging markets (EM) equities have gone through cycles of performance throughout time, creating varied investor sentiment towards the asset class. Recently, discussions around excluding China from investment portfolios have become more common, spurring the growth of active EM ex-China strategies. This newsletter explores the current landscape of EM investing, examines the drivers of the EM ex-China trend, and analyzes the performance impact of removing China from an EM allocation.
Are You Ready for Some Fixed Income?
As the leaves change to autumn and the authors cheer on their Fighting Leathernecks, fall is the perfect time for investors to reassess their fixed income portfolios. Fixed income is a hybrid security that offers both offensive and defensive properties. Much like a good football team, a fixed income portfolio needs to combine a strong offense with a solid defense.
Some strategies provide more offensive characteristics while others are more defensive. Portfolios with too much offense act like the Greatest Show on Turf. They do well when the economy is strong, but falter in down markets. Conversely, a fixed income portfolio that is overly reliant on defensive strategies will do well in a risk-off environment but will struggle in a strong economy like the Super Bowl Shufflin’ ’85 Bears.
While those were great teams, they were not a dynasty that stood up to the test of time. To build an all-weather fixed income portfolio that will perform in multiple market environments, an investor needs to balance offense and defense.
Fixed income has three primary objectives: income, diversification, and liquidity. Income, or yield, is what an investor is paid for loaning money to another entity. Fixed income helps to diversify portfolios primarily through duration. When risk assets are selling off, interest rates are generally falling. Duration is what drives fixed income prices higher in such scenarios. Finally, fixed income assets can be a source of liquidity. The weight of these qualities is dependent on if the strategy is more offensive- or defensive-minded.
This white paper outlines offensive and defensive fixed income characteristics and strategies and considerations for investors when building a “gameplan” for their fixed income allocation.
The Magnificent Five of Private Equity

In investment management, asset allocators and their advisors frequently revisit the concept of portfolio diversification — whether by geography, market capitalization, security, or industry. While Marquette advocates for a diversified portfolio within private markets, it is important to recognize that not all diversification strategies are equally effective. Certain industry characteristics make specific sectors more attractive for private investments, particularly those that exhibit sustainable growth driven by favorable demographic or secular trends, fragmentation, capital constraints, and market inefficiencies. These features are often advantageous in private markets as they create opportunities for value enhancement and potential alpha generation.
Within the private equity asset class, five core sectors — what we refer to as the “magnificent five” — have consistently dominated merger and acquisition activity over the past six years. These sectors are healthcare, technology, industrials, business services, and financial services. According to Dealogic, over 60% of deals across 13 tracked industries have been concentrated within these five sectors, as measured by transaction count. Moreover, these industries have outperformed relative to top-quartile multiple on invested capital (MOIC). It is therefore logical that private equity managers would focus their capital in areas with higher probabilities of outsized returns, which in turn shapes the composition of investor portfolios. It is also important to note that this concentration also intensifies competition for deals within these sectors.
A critical point to consider is the dispersion of returns between top and bottom quartiles across industries — the wider the dispersion, the greater the risk. It is no surprise that the highest-performing industries, healthcare and technology, are often heavily represented in private equity portfolios. In this competitive and risk-laden environment, particularly within the private equity asset class, manager selection becomes increasingly crucial for investors seeking to achieve superior outcomes.
Impact of SEC Rule Changes for Money Market Funds Regulatory Update
Over the past year, the SEC has been phasing in regulatory changes for money market funds resulting from adopted amendments to Rule 2a-7. These amendments were passed on July 12, 2023, in response to the stress that money market funds faced at the start of the pandemic in March 2020 when investors rapidly pulled more than $130 billion dollars from money market funds. As a result, the Treasury and Federal Reserve had to step in to provide emergency liquidity facilities to shore up the short-term funding market. The changes primarily focus on institutional prime and tax-exempt money market funds, which have historically been more susceptible to investor runs.
This regulatory update summarizes these changes as well as which fund types are impacted.
The Growing Popularity of Continuation Funds
Historically, the private equity secondary market has been used by limited partners (“LPs”) to sell exposures at the end of their lives and as such contained only tail-end exposures. Selling these lingering exposures to private equity funds allowed LPs to clean up their balance sheets and fueled the growth of secondary private equity funds within the broader private equity space. As the market evolved, however, higher-quality assets began transacting as investors started to use secondary markets as a useful portfolio management tool. More recently, general partners (“GPs”) have come to occupy an increasing percentage of the overall market. In 2023, about $110 billion in volume traded in private equity secondaries, with about 50% of the total transaction activity represented by GP-led transactions.
In this newsletter, we provide an overview of continuation funds, including their growth, structure, transaction requirements, and considerations for investors.