
Commodities represent a unique asset class within global financial markets. Like equities and bonds, commodity prices are influenced by the macroeconomic environment, geopolitical events, and technological developments. However, because commodities are tangible assets, their prices are also directly affected by physical supply-and-demand dynamics, weather patterns, and other factors unique to underlying resource markets. Recent structural trends, including rising demand for metals within the technology and renewable energy sectors, have created secular tailwinds for certain commodities that potentially complement the asset class’s traditionally cyclical characteristics. Additionally, evolving energy market dynamics may provide further structural support. Years of underinvestment in conventional energy production coupled with recent geopolitical conflicts and damage to critical infrastructure in the Middle East have increased concerns about the long-term resilience of global energy supply chains, potentially supporting elevated energy prices relative to historical norms. Simultaneously, global inflationary pressures and conflicts across the world have renewed interest in commodity allocations as a hedge against macroeconomic uncertainty and geopolitical strife. This paper examines the viability of commodities in institutional portfolios by exploring the dynamics of commodity cycles and demand drivers, analyzing the historical performance of the asset class, and outlining risk management considerations. By reviewing both opportunities and challenges, the paper aims to provide a balanced and educational assessment for institutional investors seeking to understand the role of commodities in modern portfolios.
Topic Tags: Commodities
A Renewed Focus on Renewables
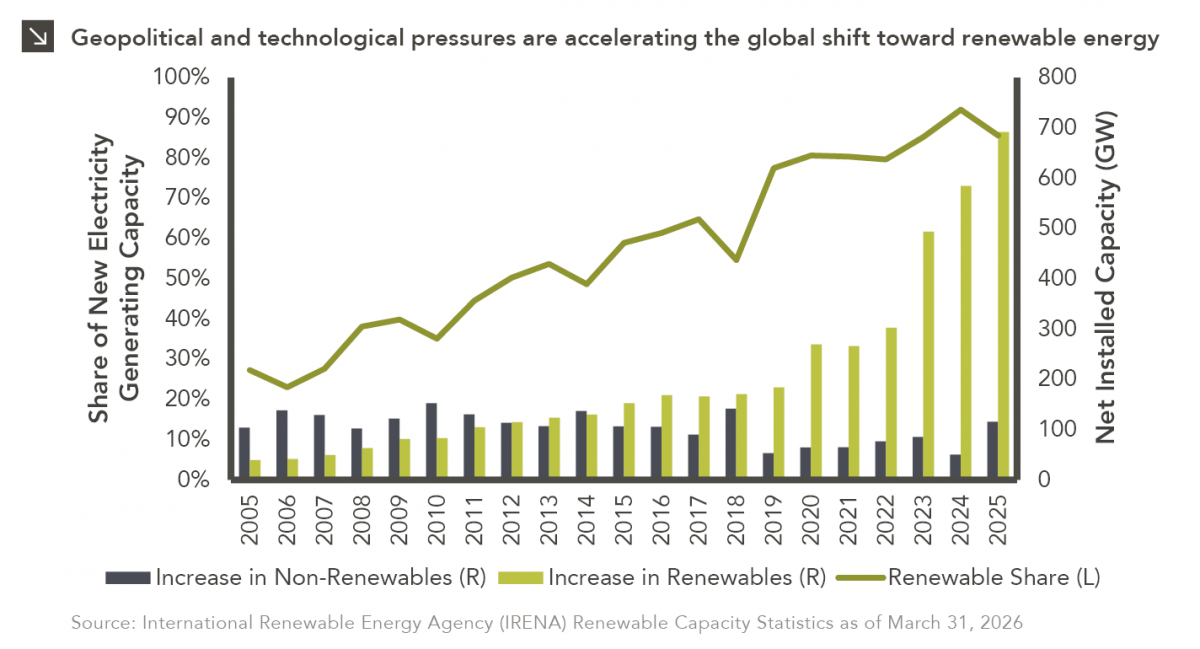
In addition to the humanitarian toll of the conflict in Iran, the world is currently confronting the impact that trade disruptions in the Strait of Hormuz are having on energy markets. To this point, oil importing nations in Asia are bearing the brunt of these disruptions, with many of these countries instituting measures like school and work closures, transportation restrictions, and manufacturing cutbacks in order to save on fuel costs. These dynamics underscore the strategic importance of energy independence and could ultimately result in meaningful shifts in how various countries power their economies.
While the conflict may lead governments to see the value of diversifying energy sources in a new light, the search for alternatives to fossil fuels is not new. Along with environmental concerns, reliance on finite resources imposes limitations on power generation capacity. Those limits are at odds with groundbreaking technological advancements in artificial intelligence, which are propelled by infrastructure that requires vast amounts of energy to operate. As illustrated in the chart above, more than half of newly installed energy capacity in the last five years has come from renewable sources like solar and wind, and that share is still increasing. Countries like China and Brazil are leaders on this front, with 58% and 87% of their energy capacity additions coming from renewables last year, respectively. Opportunities for investment should continue to emerge as countries around the world commit capital to expanding renewable energy infrastructure, making this a trend worth monitoring for investors going forward.
We’ve Seen This Before
Diversify. Rebalance. Stay invested. Every one of these letters has concluded with that same advice in some shape or form. It’s not particularly shiny and new, but the best documented path to a successful long-term investment program. The last eight weeks are another data point in support of these practices.
In this edition:
- Impact of U.S.–Iran conflict on oil prices, interest rates, and equity markets
- Volatility and drawdowns in the market cycle
- Equity market rotation
- Magnificent 7 detraction and increased market breadth
- Slowdown in non-U.S. equities
1Q 2026 Market Insights Webinar

This video is a recording of a live webinar held April 16 by Marquette’s research team analyzing the first quarter across the economy and various asset classes as well as themes we’ll be monitoring in the coming months.
Our quarterly Market Insights series examines the primary asset classes we cover for clients including the U.S. economy, fixed income, U.S. and non-U.S. equities, hedge funds, real assets, and private markets, with commentary by our research analysts and directors.
Featuring:
Greg Leonberger, FSA, EA, MAAA, FCA, Partner, Director of Research
James Torgerson, Senior Research Analyst
Fred Huang, Research Analyst
David Hernandez, CFA, Director of Traditional Manager Search
Evan Frazier, CFA, CAIA, Senior Research Analyst
Dennis Yu, Research Analyst
Hayley McCollum, Senior Research Analyst
Sign up for research alerts to be invited to future webinars and notified when we publish new videos.
If you have any questions, please send our team an email.
Pain at the Pump

Global energy costs have risen sharply this month due to a convergence of geopolitical shocks, as critical infrastructure and transport routes have been severely disrupted in the wake of U.S. strikes on Iran. Specifically, oil prices have climbed above $100 per barrel for the first time since 2022, while European gas futures have nearly doubled from late February levels. These developments have led to pain at the pump for many in the U.S., where the cost of a gallon of regular, unleaded gasoline has risen to more than $3.96 as of this writing. This figure represents a roughly 33% increase from the national average just one month ago.
It is hard to understate the importance of the Persian Gulf region to commodities markets, with the Strait of Hormuz alone typically handling around a quarter of seaborne oil and a significant share of liquefied natural gas (LNG) shipments. The effective closure of this waterway has choked off a vital artery for the global energy trade, and damage to the LNG export capacity of Qatar has further tightened markets. With shipping traffic in the region reduced or halted due to security risks, traders are now pricing in the possibility of prolonged energy shortages. The current situation is particularly acute because ongoing disruptions affect not just production but also the transportation of commodities that have already been produced, amplifying the supply squeeze. Additionally, oil producers in the Gulf have scaled back output as storage capacity reaches its limits, both on land and aboard tankers offshore. According to the International Energy Agency, production has been reduced by at least 10 million barrels per day, which represents more than half of the volume that typically passes through the Strait of Hormuz.
Beyond the immediate supply loss, markets are also responding to the risk of sustained or worsening disruption. Damage to key facilities (e.g., large-scale LNG processing plants) could take years to fully repair, raising the prospect of a prolonged imbalance between supply and demand. Meanwhile, continued military escalation increases the likelihood that additional infrastructure could be targeted. This uncertainty has led to a risk premium being embedded in prices, as buyers compete to secure alternative supplies and hedge against future shortages. In effect, the combination of physical damage, logistical bottlenecks, and geopolitical risk has created significant upward pressure on energy prices, with potential ripple effects across inflation, industrial activity, and global economic growth.
Precious Metals Lose Their Luster… Perhaps

Precious metals have been going on a magnificent run in recent years. Specifically, gold moved from $1,898/ounce at the end of 2020 to $5,375/ounce on January 29 of this year, which represents a gain of 181%. During that same time, silver exhibited a more volatile but highly correlated return pattern, moving from $26/ounce to $116/ounce for a gain of 338%. Then came Friday, January 30. On that day, gold dropped more than 12%, its biggest intraday decline since the early 1980s. Silver plunged by a staggering 36%, a record intraday decline for the metal. The fall continued in February, with gold and silver falling to $4,661/ounce and $79/ounce, respectively. Markets have bounced back somewhat in recent days, with gold climbing by roughly 6% and 3% on Tuesday and Wednesday of last week, respectively. Silver advanced on those days as well. Despite this recent pop, many investors are asking the following question given the sharp decline in gold and silver: Have precious metals lost their luster?
To answer this question, it is worthwhile to first outline the reasons for the run-up in gold and silver over the last several years. A primary factor driving strong precious metal performance is global inflation and geopolitical instability (e.g., tensions between the U.S., Russia, China, and the Middle East) that has pushed investors to seek safety in more traditional stores of value. Tariffs and trade-related conflicts have exacerbated this flight to perceived safety. Additionally, developed economies continue to run significant budget shortfalls, leading investors to gold over bonds as governments continue to issue debt to fund deficits. Individual investors are not the only ones that are adding to their gold reserves, as central banks around the world have been purchasing record amounts of gold in recent years as part of a push toward tangible asset ownership. Finally, there have been tailwinds specific to silver, including a structural deficit, thinner trading markets, and its usage in AI infrastructure, data centers, electric vehicles, and solar panels.
After the rally came the fall on January 30, when the Trump administration tapped Kevin Warsh to lead the Federal Reserve. Traders viewed Warsh as the toughest inflation fighter among the finalists for the position, and his nomination increased expectations of U.S. dollar strengthening and weaker precious metals in dollar terms. The slide in precious metals may have been exacerbated by a gamma squeeze, in which dealers must sell positions as prices fall to maintain balanced portfolios.
Fast markets make commentary quickly obsolete, and it is possible that metals markets will exhibit additional volatility in the weeks ahead. This volatility, as well as potential storage costs and the speculative nature of the space, are drawbacks of precious metals investing, and investors should treat commodities like gold and silver with caution given these risks. Time will tell if gold and silver have indeed lost their luster.
I Drink Your Milkshake
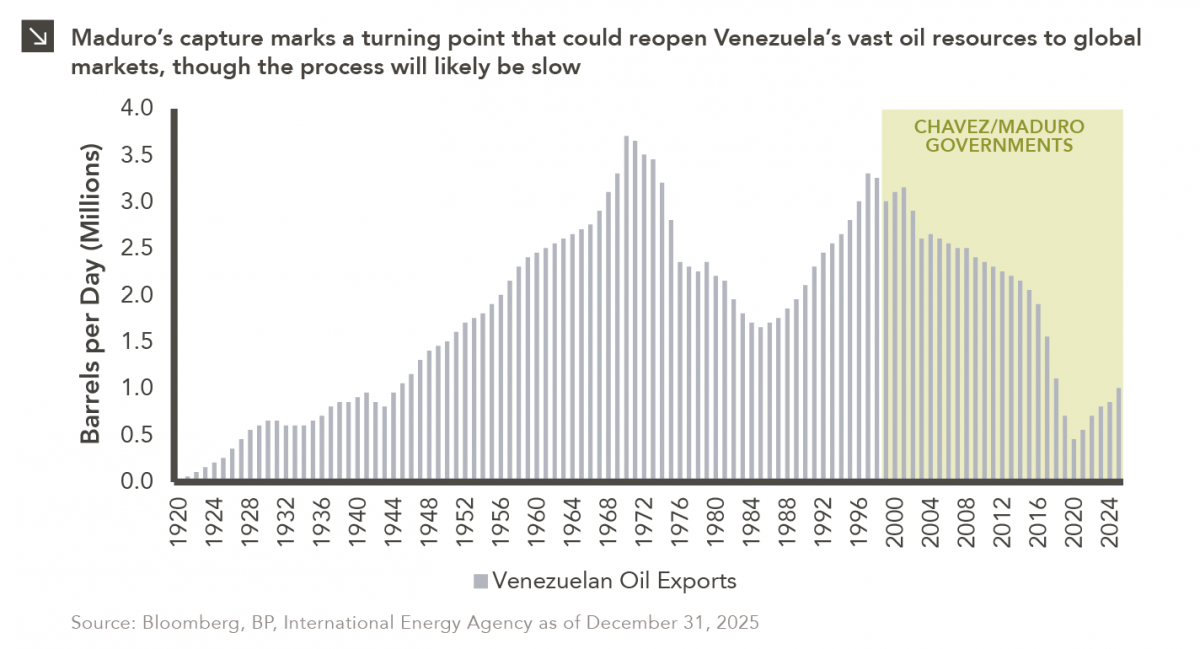
The capture of Venezuelan president Nicolás Maduro is a watershed moment for a country whose natural resource economy has been managed by an interventionist, state-centric regime for nearly 30 years. Indeed, Maduro’s detention effectively ends the command-and-control model that had long governed Venezuela’s oil sector, in which the state-owned oil company PDVSA functioned largely as a political instrument rather than a commercial enterprise. Once a technically competent producer, PDVSA was hollowed out in the early 2000s as revenues were diverted to fund government spending, skilled workers were purged, and maintenance and reinvestment were neglected. As can be seen in this week’s chart, this led to a steep decline in Venezuelan production and export capacity. For global markets, the immediate significance of the ousting of Maduro lies less in the regime change itself than in the potential reopening of one of the world’s largest hydrocarbon endowments after years of sanctions and operational decay.
In the short run, Venezuelan oil exports are likely to increase modestly but unevenly. Although the nation’s output has already started to recover from its 2020 trough due to limited sanctions waivers and ad hoc deals, infrastructure constraints remain severe. Years of deferred maintenance have left pipelines, ports, and storage facilities in poor condition, while a shortage of skilled labor and reliable power continues to limit throughput. As a result, any additional barrels reaching export markets will likely come primarily via better utilization of existing fields rather than large-scale new investment, at least over the coming months. Deals that redirect crude toward the United States (particularly heavy oil suited for Gulf Coast refineries) could shift trade flows quickly, but they do not solve the deeper structural problems of the industry. Near-term export gains are therefore likely to be measured in hundreds of thousands of barrels per day rather than a return to Venezuela’s historical multi-million-barrel output.
Over a longer time horizon, the toppling of Maduro could reshape Venezuela’s oil sector more profoundly by altering its relationship with foreign capital and global commodities markets. International oil companies have long viewed Venezuela’s reserves as attractive but effectively uninvestable due to sanctions risk, opaque governance, a history of expropriation, and weak contract enforcement. A political realignment raises the possibility of a gradual normalization of commercial terms, including joint ventures, profit-sharing mechanisms, and clearer legal protections for market participants. However, analysts widely agree that rebuilding production capacity would be a long and risky process, likely requiring tens of billions of dollars and many years of stable policy. Further complicating matters is Venezuela’s exceptionally high methane intensity, which makes its crude oil among the most emissions-intensive in the world and increasingly problematic for buyers facing stricter environmental standards. Addressing these environmental liabilities would add both cost and time to any meaningful expansion of exports.
Beyond oil, Venezuela’s broader natural resource abundance adds an additional layer of significance to the recent change in leadership. Specifically, the country sits atop substantial reserves of gold and other strategic minerals, and renewed export capacity could feed into a broader bull market in commodities if supply constraints ease. It is important to remember, however, that recent events do not automatically translate into a clean political transition, and the near-term outlook for Venezuelan commodities exports remains shaped by institutional fragility, security risks and unresolved questions about who exercises authority over production, contracts, and revenues. Ultimately, Maduro’s capture creates an opening rather than a resolution, as it increases the probability that Venezuelan resources re-enter global markets at scale, but it does not eliminate the risks that have defined the country’s commodities sector for years.
Don’t Call It a Comeback, Gold’s Been Here for Years
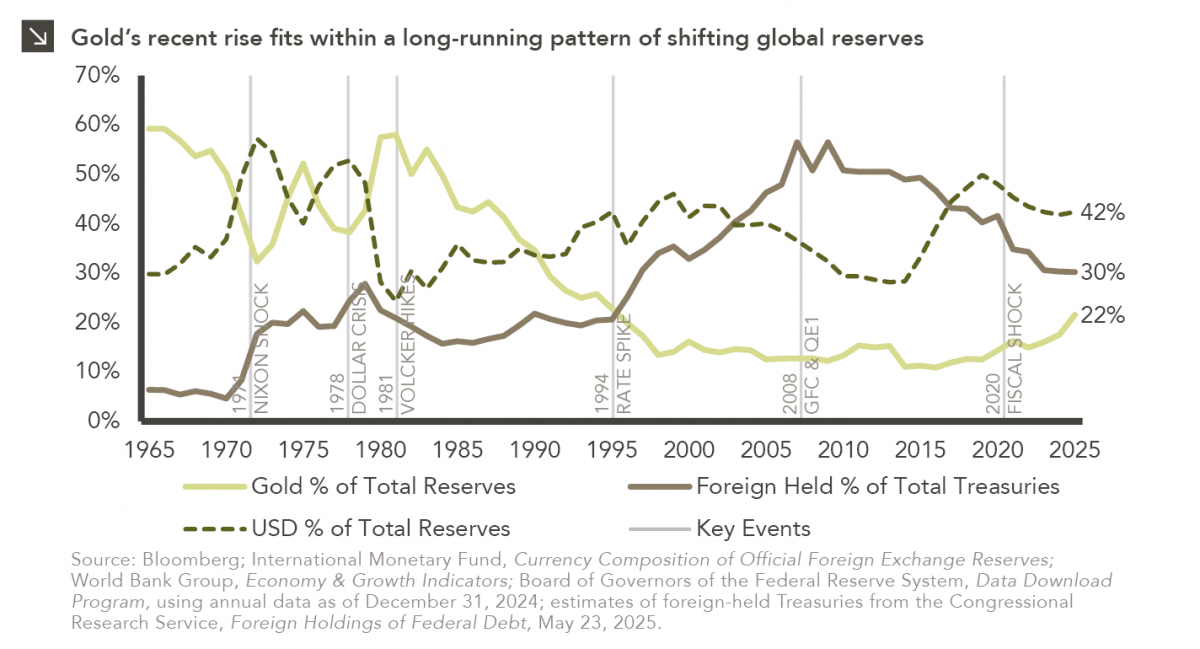
With gold now trading near $4,000 per ounce after a steady multi-year climb, investor attention has turned to the potential role of the commodity in markets and portfolios. Some may view gold’s rise cautiously given shifting perceptions of U.S. policy and debt sustainability, questioning whether the rally reflects a meaningful shift in safe-haven preferences or simply the latest stretch of momentum.
The opinions of most investors have been shaped by an era in which attractive real yields, credible policy, and deep liquidity positioned Treasuries as the world’s premier safe-haven asset. As global reserves and risk frameworks increasingly centered on Treasuries and the dollar, gold’s role as a monetary anchor naturally faded. This week’s chart helps highlight this transition, and the events detailed above underscore how shifts in confidence have shaped market behavior. The Nixon Shock in 1971 ended gold convertibility and closed a monetary era in which trust in the dollar rested on the gold anchor, giving way to one in which confidence hinged on U.S. policy credibility. That credibility was tested early in 1978, when the Dollar Crisis revealed how unsettled the fiat transition remained and required coordinated intervention to steady the currency. By 1981, rate hikes had pushed real yields higher and helped tame inflation, providing the foundation the new system needed. As inflation cooled and credibility strengthened, Treasuries became the stabilizing asset of choice, helping set the conditions for the multi-decade bond bull market that followed (a dynamic that would surface again with the 1994 rate hikes). Decades later, the landscape shifted again with the Global Financial Crisis and quantitative easing by the Federal Reserve. Long-term yields compressed, central bank balance sheets expanded, and the dollar’s share of total reserves began a gradual decline. The pandemic shock in 2020 accelerated these dynamics as debt expanded and real yields turned negative. In recent years, central banks and affiliated institutions have been gradually increasing their gold holdings as a precaution against persistent macroeconomic and geopolitical strains.
Viewed through this lens, gold’s renewed relevance carries a familiar echo. Specifically, the commodity often strengthens when global confidence in the dollar feels tenuous. From this perspective, the recent rally may signal a shift away from a Treasury-centric period rather than any departure from gold’s longstanding function (i.e., a store of value). In that context, conversations regarding the role of gold may broaden from here.
Oil Pressure?
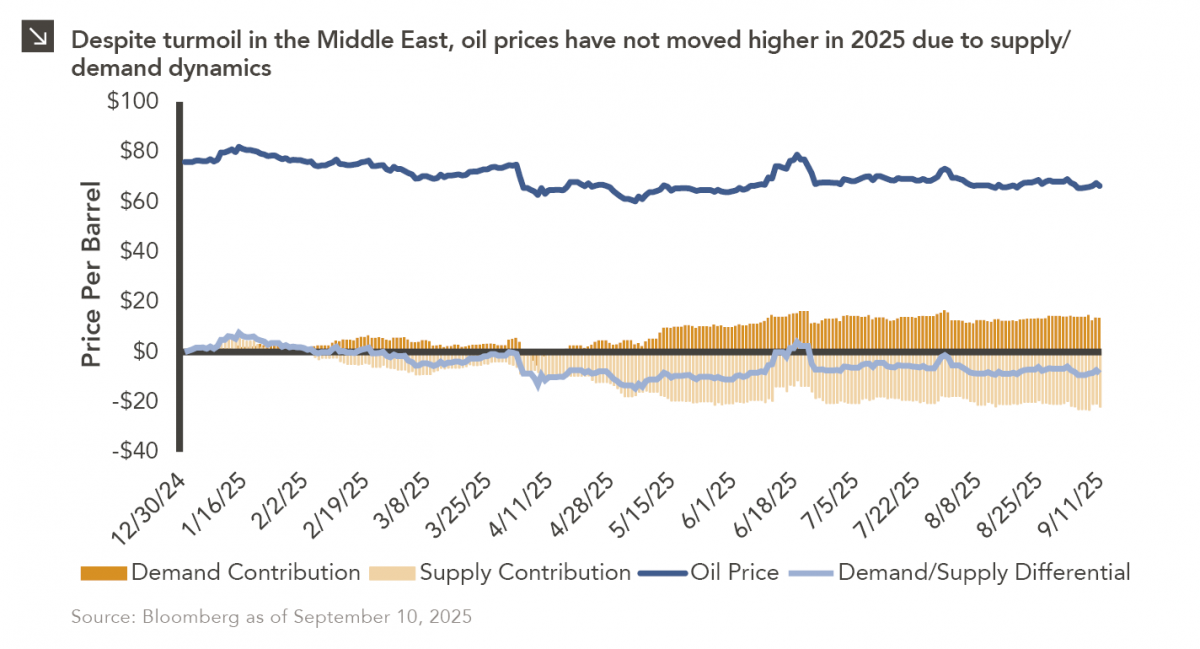
Earlier this year, Marquette published a Chart of the Week that detailed the muted change in oil prices in the aftermath of U.S. strikes on Iranian nuclear facilities. Tensions in the region have persisted in recent time, with last week seeing Israeli airstrikes that targeted Hamas leadership in Qatar. In response to this development, oil ticked higher as investors assessed the increased risk of commodity supply chain disruptions but later gave back most of these gains. This represents a continuation of the trend exhibited during most of 2025, in which geopolitical shocks do not materially increase the price of oil. One possible explanation for this dynamic would be persistently elevated supply of the commodity.
As displayed in the chart above, there has been a sustained imbalance between oil supply and demand for most of the last six months, with supply outpacing demand. Indeed, OPEC+, which includes the Organization of Petroleum Exporting Countries, Russia, and other allied producers, has moved to aggressively raise output in 2025, which has resulted in a production capacity increase of over two million barrels per day since April. Despite this already increasing supply, OPEC+ recently made an agreement to add an additional 137,000 barrels per day to its production capacity in October. These increases in capacity have significantly outpaced global demand, driving prices lower and widening the oil supply glut. Going forward, while geopolitical instability may support temporary price increases, the longer-term outlook for oil remains clouded by excess supply and uncertainty surrounding future consumption of the commodity.
Oil Pares Gains After U.S. Strikes Iran

Last week, Marquette released a publication detailing the importance of the Strait of Hormuz within the context of the global oil trade given recent tensions in the Middle East. Over the weekend, these tensions escalated materially, with the United States carrying out a bombing campaign against multiple nuclear enrichment facilities in Iran. In response, Iranian officials launched a missile attack on a U.S. military installation in Qatar and have threatened to close the Strait of Hormuz, a measure that would need to be ratified by the country’s parliament and national security council. Experts agree that such an undertaking would be highly problematic for the global economy and China in particular, which accounts for roughly 90% of Iran’s oil exports (around 1.6 million barrels per day). Goldman Sachs estimates that a closure of the strait could push the price of oil to more than $100 per barrel.
Interestingly, despite these developments, oil prices have not moved significantly higher in recent time. Brent crude, the international oil benchmark, did climb above $81 per barrel immediately after the U.S. strikes, but has since dropped back to around $72 per barrel as of this writing. Interestingly, most of this decline occurred after the missile attack on the U.S. airbase in Qatar, which may have led investors to believe that oil flows will not be the primary target of the Iranian military going forward. The current figure of $72 per barrel, while still above the five-year average level for Brent crude oil, is largely in line with where the commodity has traded since 2021. Equity markets do not seem particularly phased by this weekend’s strikes either, with major global stock indices finishing Monday in positive territory. These positive dynamics amid a string of negative headlines likely stem from the fact that the Strait of Hormuz has yet to be officially closed, although analysts have reported a slowdown in shipping navigation through the strait since the U.S. strikes. Clearly, much uncertainty remains related to the situation in the Middle East, and asset prices could see increased volatility in the near term depending on the next moves by any of the countries involved.