1Q 2026 Market Insights Webinar

This video is a recording of a live webinar held April 16 by Marquette’s research team analyzing the first quarter across the economy and various asset classes as well as themes we’ll be monitoring in the coming months.

Our quarterly Market Insights series examines the primary asset classes we cover for clients including the U.S. economy, fixed income, U.S. and non-U.S. equities, hedge funds, real assets, and private markets, with commentary by our research analysts and directors.

Featuring:
Greg Leonberger, FSA, EA, MAAA, FCA, Partner, Director of Research
James Torgerson, Senior Research Analyst
Fred Huang, Research Analyst
David Hernandez, CFA, Director of Traditional Manager Search
Evan Frazier, CFA, CAIA, Senior Research Analyst
Dennis Yu, Research Analyst
Hayley McCollum, Senior Research Analyst

Sign up for research alerts to be invited to future webinars and notified when we publish new videos.

If you have any questions, please send our team an email.


A Portfolio Needs Structure: An Overview of the Securitized Credit Asset Class

Fixed income is the largest global financial market and often one of the largest allocations within institutional investors’ portfolios. A typical fixed income allocation implements an investment grade anchor with a few “satellite” mandates — most commonly high yield bonds, leveraged loans, and emerging market debt — that carry more credit risk but provide higher levels of yield. Fixed income portfolios are often over-exposed to corporate borrowers through both anchor and satellite allocations. Additionally, these satellite allocations usually increase corporate credit risk while reducing equity diversification that fixed income is supposed to provide. Securitized credit provides higher yields and more compelling diversification benefits.

Securitized credit is a large asset class that has been largely ignored by institutional investors due to under-representation in fixed income indices, perceived complexities, and a stigma from its role in the Great Financial Crisis. While factors responsible for under-allocation to securitized credit have merits, these have caused investors to overlook the benefits of the asset class. Securitized credit provides a spread and yield premium relative to similarly rated corporate credit, diversified risk exposure to various credit and market cycles, and lower correlation to both traditional fixed income and equities. Overall, securitized credit’s attributes can help to further optimize portfolio structures.

Seventy-Five Horses and Two Pieces of Plastic

Anyone who has gone snowmobiling knows it can be simultaneously exhilarating and terrifying. Throttling across snow and through a forest powered by a 75-horsepower engine with two plastic skis to steer makes it hard to feel like one has complete control; 30 mph in the open air feels more like 100!

Nonetheless, operating a snowmobile is pretty straightforward: The throttle is a right-thumb button, the brake is a left-hand squeeze lever. Beyond those two controls, it’s up to the driver to effectively navigate the trail, with the critical concession that the terrain is out of anyone’s complete control. Which brings me to our 2026 market outlook.

The “throttles” for portfolios are the usual constituents: equities, below investment grade credit, and private markets. The “brakes” are investment grade fixed income, particularly Treasuries which can slow a portfolio’s losses if the market tumbles. The terrain is naturally the actual path that each of these asset classes will follow in 2026. Since 2022 the equity market ride has been mostly exhilarating, save for some of the terrifying moments like the market dip after Liberation Day. But that’s in the rearview mirror, and the focus is what is around the bend. Will the thrill continue, or should we ease up on the throttle?

2026 Market Preview

This video is a recording of a live webinar held January 15 by Marquette’s research team analyzing 2025 across the economy and various asset classes as well as themes we’ll be monitoring in 2026.


Our quarterly Market Insights series examines the primary asset classes we cover for clients including the U.S. economy, fixed income, U.S. and non-U.S. equities, hedge funds, real assets, and private markets, with commentary by our research analysts and directors.

Featuring:
Greg Leonberger, FSA, EA, MAAA, FCA, Partner, Director of Research
Frank Valle, CFA, CAIA, Associate Director of Fixed Income
James Torgerson, Senior Research Analyst
Catherine Hillier, Senior Research Analyst
David Hernandez, CFA, Director of Traditional Manager Search
Evan Frazier, CFA, CAIA, Senior Research Analyst
Dennis Yu, Research Analyst
Amy Miller, Associate Director of Private Equity
Chad Sheaffer, CFA, CAIA, Associate Director of Private Credit

Sign up for research alerts to be invited to future webinars and notified when we publish new videos.

If you have any questions, please send our team an email.

Where Should Investors Land on the Aggregate Continuum?

Contrary to widespread belief, fixed income aggregate strategies offer a continuum of active risk and return profiles. While aggregate strategies broadly aim to provide income, diversification, and liquidity, varying degrees of excess return exist. Investors must choose what suits their active risk and return goals.

Fixed income mandates are described by their beta and benchmarked to a similarly named index. For example, long credit is benchmarked to the Bloomberg Long Credit Index and high yield is benchmarked versus the Bank of America High Yield Master II Index. Once a beta is selected, then an alpha objective is chosen for the mandate. Some mandates in the universe have an alpha target of benchmark plus 50 basis points (bps), while others target an excess return of 100bps or more.

However, this is not true for aggregate strategies. The beta and index are the Bloomberg Aggregate Index. Rather than having different objectives, aggregate mandates have different “asset classes.” The aggregate continuum should not be thought of as different asset classes, but rather different active risk and return profiles.

This white paper outlines considerations for investors when choosing a fixed income aggregate strategy, including an overview of the Bloomberg Aggregate Index, how investment managers can generate active risk, excess return targets, and the important distinction between risk and active risk.

Big “Issues” for Big Tech

While technology-oriented firms have made their presence known in equity markets for several years, these companies have made waves in the fixed income space recently as well. Companies such as Alphabet, Meta, and Oracle, which in the past have funded initiatives via balance sheet cash, have increasingly turned to the bond market to finance the buildout of AI-related infrastructure. Specifically, a total of nearly $240 billion worth of investment-grade bonds have been sold by technology giants on a year-to-date basis through the end of November. Some notable deals in 2025 include Meta’s $30 billion bond sale, the largest in the U.S. high-grade market this year, Oracle’s $18 billion issuance in September, and Alphabet’s deal that raised $17.5 billion in the U.S. and another €6.5 billion (roughly $7.5 billion) in Europe.

This surge in supply carries meaningful implications for the broader investment-grade corporate market, which is one of the most heavily traded areas of fixed income. For instance, the sheer volume of new issuance from technology companies can put upward pressure on corporate spreads as investors demand slightly higher yields (despite the strong balance sheets and generally low leverage of these firms). There is also the question of the potential return on AI-related spending (or lack thereof). Indeed, a recent MIT study found that around 95% of companies have yet to see any meaningful payoff from their generative AI efforts. At the same time, investors and creditors are growing more cautious, increasing their use of derivatives designed to pay out if specific technology firms fail to meet their debt obligations. That said, investment in AI-related infrastructure seems likely to continue at full speed in the years ahead, meaning technology firms may continue to tap the investment-grade market for financing.

3Q 2025 Market Insights

This video is a recording of a live webinar held October 22 by Marquette’s research team analyzing the third quarter across the economy and various asset classes as well as themes we’ll be monitoring through the rest of 2025.

Our quarterly Market Insights series examines the primary asset classes we cover for clients including the U.S. economy, fixed income, U.S. and non-U.S. equities, hedge funds, real assets, and private markets, with commentary by our research analysts and directors.

Featuring:
Greg Leonberger, FSA, EA, MAAA, FCA, Partner, Director of Research
Frank Valle, CFA, CAIA, Associate Director of Fixed Income
James Torgerson, Senior Research Analyst
Catherine Hillier, Senior Research Analyst
David Hernandez, CFA, Director of Traditional Manager Search
Evan Frazier, CFA, CAIA, Senior Research Analyst
Dennis Yu, Research Analyst
Amy Miller, Associate Director of Private Equity

Sign up for research alerts to be invited to future webinars and notified when we publish new videos.

If you have any questions, please send our team an email.

2025 Investment Symposium

Watch the flash talks from Marquette’s 2025 Investment Symposium livestream on September 26 in the player below — use the upper-right list icon to access a specific presentation.


Please feel free to reach out to any of the presenters should you have any questions.

Getting That Paper

Commercial paper is a type of unsecured debt instrument that can be utilized by companies to finance short-term liabilities. The U.S. commercial paper market, which eclipsed $2 trillion in total value in 2007, was decimated in the aftermath of the Global Financial Crisis, with ultra-low interest rates pushing most companies toward longer-term obligations. That said, this method of financing is currently experiencing a revival, as 2025 has seen more than $200 billion in new U.S. commercial paper issuance. This is the highest figure notched in a calendar year since 2006. Indeed, major corporations including Uber, Netflix, Coca-Cola, PepsiCo, Philip Morris, and Honeywell have recently ventured into the commercial paper market, collectively raising billions through instruments that usually mature within one to three months. Total U.S. commercial paper outstanding stood at more than $1.4 trillion at the end of August.

The recent growth of the commercial paper market reflects a notable change in how U.S. companies are choosing to finance operations. With borrowing costs elevated and trade tensions persisting, firms have opted to bolster cash reserves while avoiding the higher expense of long-term debt, particularly as potential interest rate cuts from Federal Reserve loom. This trend is consistent with the approach of the U.S. Department of the Treasury, which has relied heavily on short-term T-bill issuance to cover government funding needs. It is important to note, however, that commercial paper utilization exposes issuers to certain risks. For instance, if long-term interest rates remain high, companies could be forced to regularly roll over short-dated obligations. A surge in short-term borrowing by both businesses and the government may also increase competition for investors, raising funding costs further.

The Day Credit Spreads Died

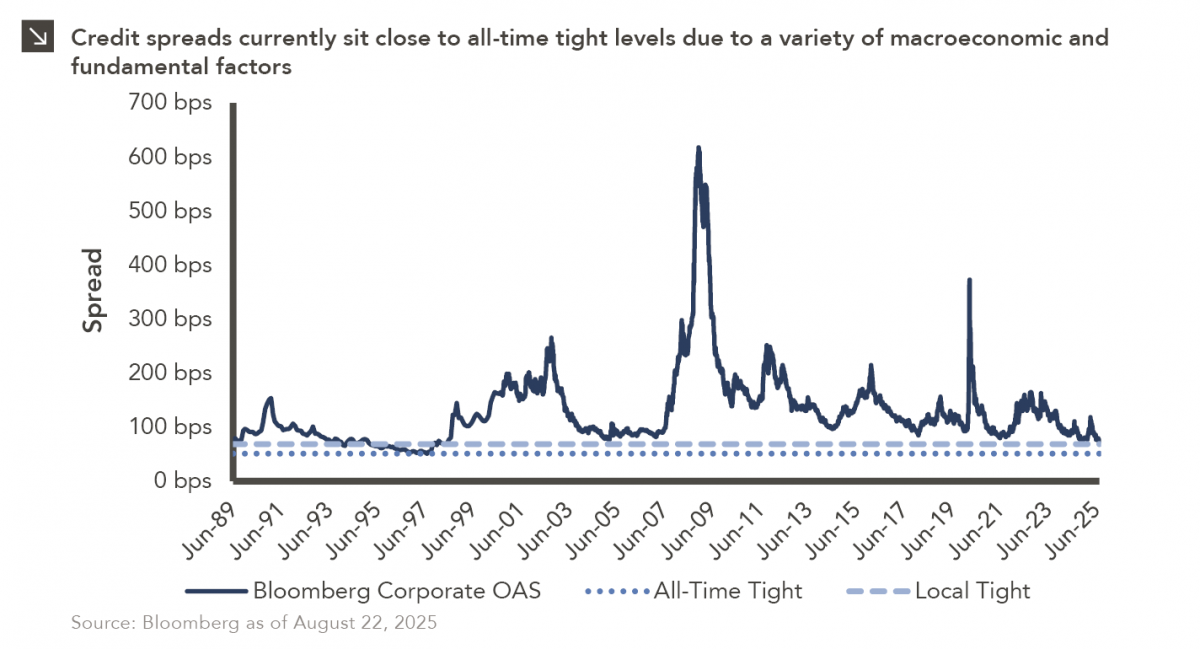
July 31, 1997 is a date which will live in infamy. On this day, FedEx Express Flight 14 crashed at Newark International Airport, baseball slugger Mark McGwire was traded from the Oakland Athletics to the St. Louis Cardinals, and the Lehman Corporate Index hit an all-time tight of 51 basis points. While not quite at all-time tight levels, credit spreads are currently partying like it’s (almost) 1999. Specifically, the Bloomberg Corporate Index, the successor to the Lehman Corporate Index, sat at 75 basis points as of August 22, 2025, the lowest level in more than 25 years. And you may ask yourself: “Well, how did I get here?”

Tight credit spreads generally indicate that investors see less risk in the market relative to government bonds, and current spreads can be examined using a combination of macroeconomic, fundamental, and technical factors. On the macroeconomic front, tariff-related volatility in the first half of 2025 caused spreads to widen, but this widening was followed quickly by a return to lower levels given progress with trade negotiations. Additionally, a strong second quarter GDP figure and moderating inflation have provided a strong backdrop for credit. When it comes to fundamentals, credit also appears healthy. The COVID-19 pandemic gave companies the opportunity to strengthen balance sheets by terming out debt at low interest rates, while corporate earnings remain favorable. With more than 92% of S&P 500 Index constituents reporting, expectations are for EPS growth of roughly 11% for the benchmark in the second quarter (on a year-over-year basis). This figure far exceeds the consensus pre-earnings estimate of 5%. Higher coverage ratios, combined with leverage ratios that have fallen significantly since the Global Financial Crisis, creates a solid fundamental backdrop for credit. Finally, on the more technical side, strong demand for risk assets has stretched valuations, and the correlation between fund inflows and credit spreads is very high. Indeed, as most bond investors are yield buyers, higher base rates have made the fixed income space more attractive, and this dynamic has pushed spreads tighter.

In conclusion, a solid macroeconomic background, strong fundamentals, and technical factors have driven credit spreads to near historic tights. Barring an exogenous market shock, spreads may remain tight in the coming months, meaning investors should exercise caution when it comes to credit given the little room for error conditions currently provide.