1Q 2026 Market Insights Webinar

This video is a recording of a live webinar held April 16 by Marquette’s research team analyzing the first quarter across the economy and various asset classes as well as themes we’ll be monitoring in the coming months.

Our quarterly Market Insights series examines the primary asset classes we cover for clients including the U.S. economy, fixed income, U.S. and non-U.S. equities, hedge funds, real assets, and private markets, with commentary by our research analysts and directors.

Featuring:
Greg Leonberger, FSA, EA, MAAA, FCA, Partner, Director of Research
James Torgerson, Senior Research Analyst
Fred Huang, Research Analyst
David Hernandez, CFA, Director of Traditional Manager Search
Evan Frazier, CFA, CAIA, Senior Research Analyst
Dennis Yu, Research Analyst
Hayley McCollum, Senior Research Analyst

Sign up for research alerts to be invited to future webinars and notified when we publish new videos.

If you have any questions, please send our team an email.


Closing Time

This week’s chart illustrates a clear structural shift in the fundraising dynamics of North American closed-end real estate funds over the past two decades. While funds in the early 2000s were typically able to reach final close within roughly 5–8 months, fundraising cycles have lengthened significantly in recent years. Indeed, the average time from first close to final close extended to approximately 25 months in 2025, reflecting a far more competitive and selective capital raising environment.

Several factors have contributed to this trend. First, institutional investors now maintain more mature private real estate portfolios and increasingly prioritize re-ups with existing managers, limiting capacity for new relationships. As a result, raising capital has become a more resource-intensive and prolonged process for fund sponsors. Additionally, real estate capital flows appear increasingly concentrated within two segments of the market: large, diversified platforms with multiple product offerings and specialized managers with clearly differentiated strategies. This dynamic raises the barrier to entry for emerging managers while reinforcing the advantage of established franchises with strong investor relationships and scalable platforms. In this environment, thorough manager due diligence is increasingly critical for real estate fund investors, who must move beyond brand recognition and carefully evaluate a manager’s sourcing capabilities, portfolio construction discipline, and ability to deploy capital effectively across market cycles. As fundraising timelines extend and capital becomes more concentrated among select platforms, investors who conduct rigorous underwriting will be better positioned to allocate to managers capable of consistently executing in a more competitive and capital-constrained real estate landscape.

Pining for Evergreens

In recent years, access to traditionally illiquid private markets has expanded through the rapid growth of evergreen funds, which provide investors with more favorable subscription and liquidity terms than traditional closed-end vehicles. New evergreen fund launches notably increased from 30 in 2018 to 107 in 2025, with alternative credit strategies emerging as the primary driver of this growth (36 new fund launches last year). Many new funds have also come to market in the private equity, real estate, and infrastructure spaces, and these dynamics can be observed in the chart above. There are more than 500 active evergreen funds available to investors currently.

Broad adoption of the evergreen structure reflects growing demand for more illiquid assets across both institutional and retail investors. In addition to the advantageous terms mentioned above, many offer seasoned and diversified exposures, which can help mitigate the J-curve effect that is exhibited within private markets. Many evergreen funds also have lower investment minimums and less operational complexity relative to closed-end vehicles. All of these factors have contributed to the proliferation of evergreens detailed above. It is important to note, however, that there are drawbacks associated with evergreen fund investing, including potential liquidity mismatches and gating risk. Overall, while evergreen funds have broadened access to private markets through greater flexibility and lower barriers to entry, investors must balance these benefits against the structural liquidity and redemption risks inherent in illiquid asset classes.

Seventy-Five Horses and Two Pieces of Plastic

Anyone who has gone snowmobiling knows it can be simultaneously exhilarating and terrifying. Throttling across snow and through a forest powered by a 75-horsepower engine with two plastic skis to steer makes it hard to feel like one has complete control; 30 mph in the open air feels more like 100!

Nonetheless, operating a snowmobile is pretty straightforward: The throttle is a right-thumb button, the brake is a left-hand squeeze lever. Beyond those two controls, it’s up to the driver to effectively navigate the trail, with the critical concession that the terrain is out of anyone’s complete control. Which brings me to our 2026 market outlook.

The “throttles” for portfolios are the usual constituents: equities, below investment grade credit, and private markets. The “brakes” are investment grade fixed income, particularly Treasuries which can slow a portfolio’s losses if the market tumbles. The terrain is naturally the actual path that each of these asset classes will follow in 2026. Since 2022 the equity market ride has been mostly exhilarating, save for some of the terrifying moments like the market dip after Liberation Day. But that’s in the rearview mirror, and the focus is what is around the bend. Will the thrill continue, or should we ease up on the throttle?

2026 Market Preview

This video is a recording of a live webinar held January 15 by Marquette’s research team analyzing 2025 across the economy and various asset classes as well as themes we’ll be monitoring in 2026.


Our quarterly Market Insights series examines the primary asset classes we cover for clients including the U.S. economy, fixed income, U.S. and non-U.S. equities, hedge funds, real assets, and private markets, with commentary by our research analysts and directors.

Featuring:
Greg Leonberger, FSA, EA, MAAA, FCA, Partner, Director of Research
Frank Valle, CFA, CAIA, Associate Director of Fixed Income
James Torgerson, Senior Research Analyst
Catherine Hillier, Senior Research Analyst
David Hernandez, CFA, Director of Traditional Manager Search
Evan Frazier, CFA, CAIA, Senior Research Analyst
Dennis Yu, Research Analyst
Amy Miller, Associate Director of Private Equity
Chad Sheaffer, CFA, CAIA, Associate Director of Private Credit

Sign up for research alerts to be invited to future webinars and notified when we publish new videos.

If you have any questions, please send our team an email.

3Q 2025 Market Insights

This video is a recording of a live webinar held October 22 by Marquette’s research team analyzing the third quarter across the economy and various asset classes as well as themes we’ll be monitoring through the rest of 2025.

Our quarterly Market Insights series examines the primary asset classes we cover for clients including the U.S. economy, fixed income, U.S. and non-U.S. equities, hedge funds, real assets, and private markets, with commentary by our research analysts and directors.

Featuring:
Greg Leonberger, FSA, EA, MAAA, FCA, Partner, Director of Research
Frank Valle, CFA, CAIA, Associate Director of Fixed Income
James Torgerson, Senior Research Analyst
Catherine Hillier, Senior Research Analyst
David Hernandez, CFA, Director of Traditional Manager Search
Evan Frazier, CFA, CAIA, Senior Research Analyst
Dennis Yu, Research Analyst
Amy Miller, Associate Director of Private Equity

Sign up for research alerts to be invited to future webinars and notified when we publish new videos.

If you have any questions, please send our team an email.

Industrial Real Estate: Smaller is Better?

This week’s chart compares realized and expected Market Revenue per Available Foot (“M-RevPAF”) growth within the industrial real estate space across three segments: The top 50 markets, smaller-building markets, and bulk building markets. M-RevPAF blends rent and occupancy into a single metric, providing a comprehensive view of market revenue performance.

Over the past several years, elevated new supply in low-barrier bulk distribution markets has pressured occupancy and rents, causing this segment to lag both smaller-building markets and the Top 50 diversified index. That gap is expected to widen further by 2029, as smaller-building markets are projected to deliver roughly five percentage points of additional cumulative revenue growth relative to bulk markets. For instance, smaller-building markets like those in infill and supply-constrained areas such as South Florida are positioned to capture stronger rent growth and maintain higher occupancy rates due to demand dynamics and limited new deliveries. Conversely, bulk distribution markets are still digesting significant deliveries from the 2021-2023 development cycle, which may keep vacancies elevated and rent growth muted for several years.

These forecasts highlight the potential for a meaningful divergence in performance across industrial subsectors, stressing the need for discipline and precision when it comes to capital allocation by asset managers. Allocations toward smaller markets can help enhance portfolio resilience and capture outperformance relative to bulk distribution markets, where managers should be employing more conservative underwriting (assuming longer lease-up periods, requiring wider exit cap rates to compensate for slower NOI growth, etc.). A diversified approach that combines Top 50 markets with targeted exposures to smaller-building strategies may offer the best balance between growth and stability for investors in the years ahead.

2025 Investment Symposium

Watch the flash talks from Marquette’s 2025 Investment Symposium livestream on September 26 in the player below — use the upper-right list icon to access a specific presentation.


Please feel free to reach out to any of the presenters should you have any questions.

What’s It All Worth?

In private markets, secondary transactions have increasingly gained attention and acceptance as a viable liquidity option for both general partners (“GPs”) and limited partners (“LPs”). During the first half of 2025, secondary market volume reached record levels, surpassing $100 billion for the first time in history. Specifically, volume totaled $102 billion in the first six months of the year, with a nearly even split between LP-led (53%) and GP-led (47%) transactions. To put this in perspective, secondary transaction volume for the entirety of 2022 was $103 billion. Although dry powder has declined in recent months — from $216 billion in 2024 to $171 billion — fundraising is expected to more than offset this decrease, with $218 billion projected to be raised over the next year.

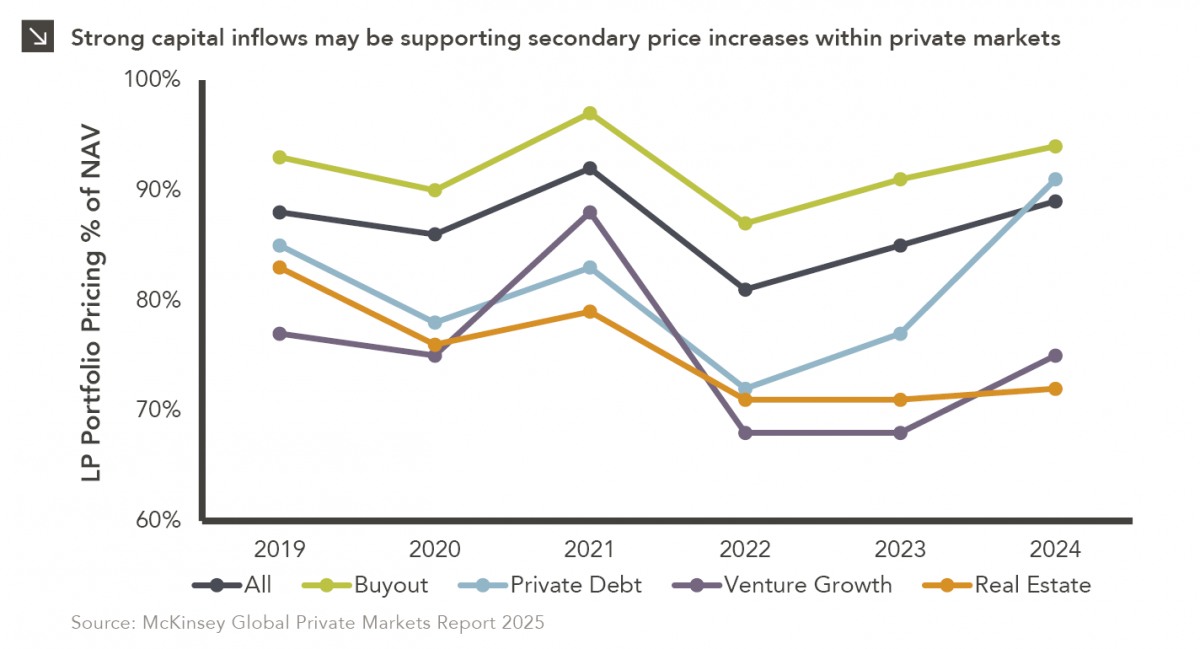
As is common with most asset classes, increased market participation leads to more capital being raised and deployed, which, in turn, drives asset prices higher. The secondary market follows this same trend. Typically, secondary transactions are priced at a discount to the net asset value (“NAV”) of the assets or stakes being sold. However, secondary pricing across all private asset classes increased in 2024, reaching 89% of NAV (up from 85% in 2023). Buyout secondaries saw the highest pricing last year, trading at 94% of NAV, while pricing of private debt secondaries jumped from 77% of NAV in 2023 to 91% in 2024. In contrast, real estate secondaries traded at the lowest percentage of NAV, settling at 72% in 2024. This figure is more consistent with the 71% trading value exhibited by real estate secondaries in 2022 and 2023.

This brings us to the central question of this piece: What’s it all worth? Simply put, whatever someone is willing to pay! But how do we value an asset purchased at a discount? Can we trust the original valuation? Historically, secondary buyers have tended to mark acquired assets up relative to the previous owner’s NAV shortly after the transaction closes, but is this a fair and accurate way to value an asset? If buyers conduct thorough due diligence, their own assessments of a company or portfolio will inform their willingness to pay market-clearing prices, meaning pricing is not determined solely by the current value of an asset. Indeed, buyer perspectives on future growth potential, exit opportunities, and comparable market transactions all influence secondary market pricing. Additionally, recent strong capital inflow for the asset class may be putting pressure on acquirers to put money to work, potentially contributing to the recent uptick in pricing.

2025 Halftime Market Insights

This video is a recording of a live webinar held July 17 by Marquette’s research team analyzing the first half of the year across the economy and various asset classes as well as themes we’ll be monitoring through the rest of 2025.


Our quarterly Market Insights series examines the primary asset classes we cover for clients including the U.S. economy, fixed income, U.S. and non-U.S. equities, hedge funds, real assets, and private markets, with commentary by our research analysts and directors.

Featuring:
Greg Leonberger, FSA, EA, MAAA, FCA, Partner, Director of Research
Frank Valle, CFA, CAIA, Associate Director of Fixed Income
James Torgerson, Senior Research Analyst
Catherine Hillier, Senior Research Analyst
David Hernandez, CFA, Director of Traditional Manager Search
Evan Frazier, CFA, CAIA, Senior Research Analyst
Dennis Yu, Research Analyst
Amy Miller, Associate Director of Private Equity
Chad Sheaffer, CFA, CAIA Senior Research Analyst

Sign up for research alerts to be invited to future webinars and notified when we publish new videos.

If you have any questions, please send our team an email.