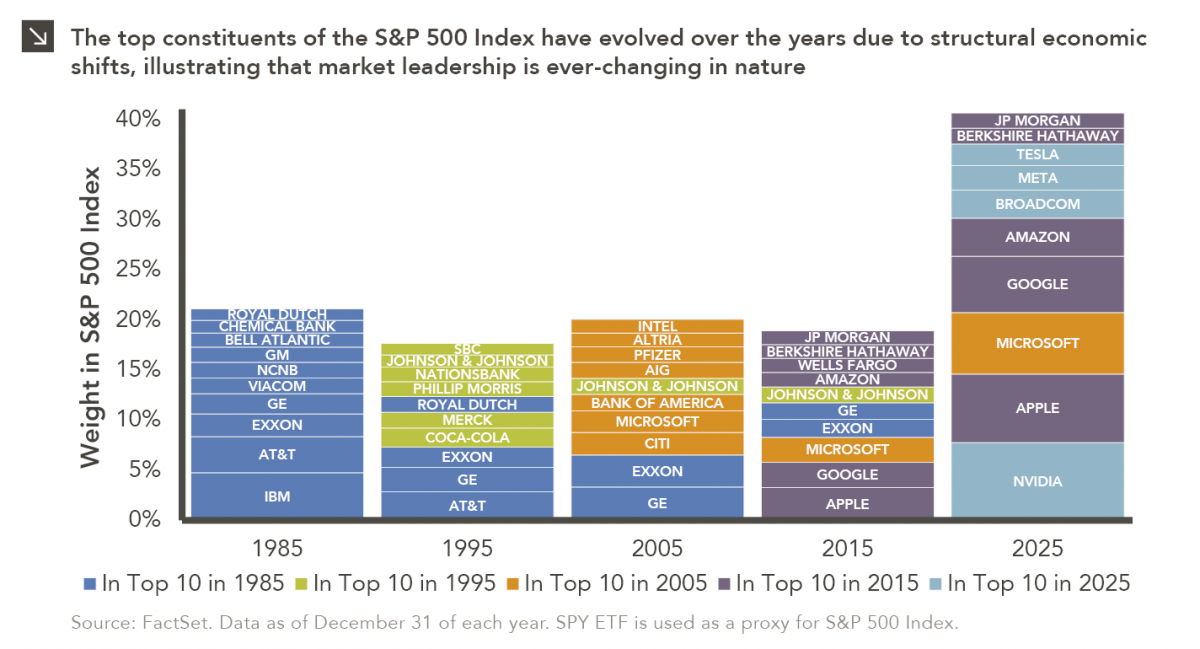
Measuring the Impact of Tariffs on Equity Performance

This week’s chart shows two indices created by Morgan Stanley that seek to track the performance of companies with different relationships to the global trade landscape. The first index, called “Tariff Exposed,” represents a group of stocks that are more negatively impacted by tariffs due to supply chains and revenue streams that are global in nature. The second, dubbed “Tariff Insulated,” tracks a basket of firms that are insulated from recent tariffs (or have mitigation strategies related to tariffs in place) due to the nature of their operations. The two indices are global, sector-neutral relative to each other, and include names across the Consumer Cyclical, Consumer Defensive, Industrials, Technology, Health Care, and Basic Materials spaces. Some of the largest constituents of the Tariff Exposed basket are Target, Deere & Co., Dell Technologies, and Intuitive Surgical. Tariffs have served as a headwind for these businesses thanks to their heavy dependence on imports (Target and Dell Technologies) and reliance on export markets (Deere & Co. and Intuitive Surgical). On the other hand, some of the largest constituents of the Tariff Insulated basket are Ulta Beauty, Levi Strauss, Domino’s Pizza, and McDonald’s. These companies have been less impacted by new trade restrictions thanks to localized sourcing of ingredients (Domino’s Pizza and McDonald’s) and diversified supplier bases (Ulta Beauty and Levi Strauss).

Since the start of 2025, the Tariff Exposed and Tariff Insulated indices have returned roughly -14.1% and -0.8%, respectively, as of this writing. Going forward, it is imperative that investors remain diversified across their equity portfolios to ensure exposure to those companies that can weather the tariff-induced storm and those that may be poised to bounce back as trade negotiations progress.

As Real Estate Finds Its Bottom, Alternative Sectors Become More Prominent

Since the onset of the pandemic, the commercial real estate market has experienced significant volatility — first benefiting from a post-pandemic surge, then grappling with a sharp downturn, and now showing signs of stabilization. With the third quarter of 2024 marking the first quarter of positive returns after eight consecutive quarters of losses, the fourth quarter performance added to the case that the asset class has found a floor. This newsletter outlines recent improvements not only across traditional sectors but also an expanding set of alternative property sectors. These alternatives, which include data centers, life sciences facilities, self-storage, and senior housing, reflect the changing composition of institutional real estate portfolios and the growing emphasis on diversification beyond the traditional core sectors. We also explore drivers of demand, specific opportunities in alternative real estate, and value-added real estate.

Growth to Gold: Wall Street’s Favorite Trade Just Changed

According to the most recent Bank of America Global Fund Manager Survey, gold has surged to the top of the list of the most crowded hedge fund trades, with 49% of respondents identifying a long position in the metal as the highest conviction play on Wall Street. This represents a significant shift in sentiment, as April marks the first month in two years that a long position in the Magnificent Seven technology stocks (i.e., Apple, Amazon, Google, Microsoft, Meta, NVIDIA, Tesla) did not top the list. This pivot reflects rising caution across investors given ongoing market volatility, persistent inflation, and uncertainty around future monetary policy. The move into gold, a traditional safe-haven asset as described in the last edition of our Chart of the Week series, suggests that fund managers are becoming increasingly defensive and seeking protection from potential further deterioration in risk assets. Indeed, the Magnificent Seven basket has fallen roughly 23% on a year-to-date basis as of this writing, and now just 24% of fund managers believe it to be the top trade given elevated valuations and the extent to which these companies are exposed to a global supply chain that has fractured due to tariffs. Conversely, gold has surged more than 28% since the start of 2025 given heightened risk aversion on the part of investors. It is important to remember, however, that gold is not necessarily a viable long-term investment given its lack of cash flows and the extent to which speculation drives its price.

1Q 2025 Market Insights

This video is a recording of a live webinar held April 16 by Marquette’s research team analyzing the first quarter of 2025 (and recent weeks) across the economy and various asset classes as well as themes we’ll be monitoring in the coming months.

Our Market Insights series examines the primary asset classes we cover for clients including the U.S. economy, fixed income, U.S. and non-U.S. equities, hedge funds, real estate, infrastructure, private equity, and private credit, with presentations by our research analysts and directors.

Featuring:
Greg Leonberger, FSA, EA, MAAA, FCA, Director of Research, Managing Partner
Frank Valle, CFA, CAIA, Associate Director of Fixed Income
Catherine Hillier, Senior Research Analyst
David Hernandez, CFA, Director of Traditional Manager Search
Evan Frazier, CFA, CAIA, Senior Research Analyst
Dennis Yu, Research Analyst
Hayley McCollum, Senior Research Analyst
Chad Sheaffer, CFA, CAIA Senior Research Analyst

Sign up for research alerts to be invited to future webinars and notified when we publish new videos.

If you have any questions, please send our team an email.


Bracing for Stagflation

As markets swirl and stagflation fears mount, what should investors do?
Our newsletter last week outlined the broad context of President Trump’s new tariff policy as well as the most notable market impacts. Granted, the news seems to change daily, as does the market’s reaction; trying to pen a targeted newsletter is an almost worthless endeavor because by the time the ink has dried, markets have shifted due to another policy pivot. In the short term, the omnipresent cloud of uncertainty will continue to drive market volatility and investor sentiment. The best recipe for investors to weather this storm is patience and discipline, both of which can be difficult to come by in the current environment.

As we step back and take a longer-term view of the future, however, the threat of stagflation is becoming more realistic. Coined as a combination of the words “stagnation” and “inflation,” it is an economic backdrop characterized by high inflation, slow economic growth, and in some cases, high unemployment.

In this edition, we examine which asset classes are most exposed to stagflation and which can offer shelter.

The Volatility Roller Coaster

Earlier this week, Marquette published a newsletter detailing the ongoing market volatility caused by the Trump administration’s recent tariff rollout. Indeed, equity markets have reacted sharply to the new trade landscape, with the S&P 500 Index having fallen roughly 11.0% from its February peak as of this writing. While a significant portion of these losses came late last week, this week has seen even more extreme market fluctuations as investors struggled to assess the impact of new trade restrictions on security prices and the global economy. Specifically, the S&P 500 Index opened lower on Monday morning before surging amid rumors that the White House was considering a pause on its reciprocal tariff measures. The Trump administration quickly denied these rumors, and the benchmark would later turn negative before ending the day slightly up from its prior close. Markets opened sharply higher yesterday but steadily lost ground due to souring sentiment and a lack of progress on trade negotiations. Today, equity markets opened slightly lower before skyrocketing after an official announcement of a 90-day pause for reciprocal tariffs on non-retaliating countries. All told, Monday, yesterday, and today saw staggering intra-day price changes in the S&P 500 Index of roughly 8.5%, 7.3%, and 10.8%, respectively (in absolute value terms).

As this week’s chart indicates, price swings of this magnitude have only been exhibited during the most extreme periods in U.S. equity market history, including the Black Monday Crash of 1987 and the Global Financial Crisis. As such, it is imperative that investors navigate the current environment with a high degree of prudence and caution, especially given the likelihood of continued volatility as trade negotiations proceed. It is also helpful to remember that investors have historically been well compensated for bearing equity risk over multi-year periods, and that short-term fluctuations are the price of positive long-term returns. Marquette continues to closely monitor dynamics within global markets and will provide timely updates accordingly. Please reach out to us with any questions.

Trade Turmoil: Assessing the Impact of Tariffs on Markets, the Economy, and Investors

The global trade landscape has been significantly reshaped by a series of aggressive tariffs initiated by President Donald Trump. These measures have elicited strong reactions from market participants and U.S. trade partners alike, leading to elevated levels of market volatility, souring economic sentiment, and strained diplomatic relations. While the situation is ongoing with major developments seemingly arising each day, this paper aims to summarize the events that have led to this point, detail the impact of the trade war on global markets, and provide commentary on what investors might expect in the months ahead.

Europe on Defense

The first 100 days of a presidential administration are typically scrutinized closely as the public develops a sense of the new government’s agenda and top priorities. The second Trump administration is certainly no exception, and the recent flurry of executive orders and tariff proposals has caused significant uncertainty for policymakers and financial markets alike. Trump’s handling of the Russia-Ukraine War has had an especially notable impact. In March, the Trump administration suspended aid to Ukraine after a tense meeting with Ukrainian President Volodymyr Zelenskyy. That decision elicited a strong response from European leaders, who now have a newfound sense of urgency when it comes to rebuilding the continent’s defense capabilities. In recent weeks, the European Commission, the executive branch of the European Union, announced its “ReArm Europe Plan,” complete with a white paper entitled “European Defense Readiness 2030.” These documents emphasize the need for Europe to bolster defense spending and outline an investment plan to do so.

Global markets took note of this dynamic well before the unveiling of the ReArm Europe Plan, with European defense stocks surging as the continent’s relationship with the Trump administration has deteriorated. To that point, the STOXX Europe Total Market Aerospace & Defense index returned roughly 28.9% in the first quarter, with noteworthy contributors including Rheinmetall, a German arms manufacturer, the French military aircraft manufacturer Dassault Aviation, and Leonardo DRS, an Italian aerospace and defense specialist. This is in striking contrast to the market leaders of 2024, including U.S.-based tech giants such as NVIDIA and Microsoft. The Magnificent Seven basket of stocks have returned roughly -16.0% so far in 2025.

While investors are understandably enthusiastic about the prospects of defense spending jumpstarting the European economy, making these defense goals a reality will not be an easy task, especially for European countries such as France that are heavily indebted with a highly taxed citizenry. One thing is for certain: The market’s response to recent defense initiatives in Europe illustrates the importance of maintaining a diversified investment portfolio, as it is difficult to predict the catalysts that will drive performance reversals like the one detailed above.

Uncertainty Fuels Meltdown in U.S. Equities

Entering 2025, investors were overwhelmingly bullish on the outlook for U.S. equities. Positive sentiment was fueled by the perceived benefits of the incoming administration, specifically the likelihood for pro-business policies and looser regulation. These expectations drove the Russell 2000 and NASDAQ to fresh all-time highs post-election, although some of this exuberance was dampened following a more hawkish tone from the Federal Reserve in mid-December. Since his inauguration, Trump has been outspoken on tariffs and government spending, but the gravity of these measures, compounded by inconsistent implementation, has led to market uncertainty. As a result, the VIX, a measure of market volatility, reached a post-election high on March 10.

Concurrent with the spike in volatility, segments of the U.S. equity market have fallen into correction territory, defined as a decline greater than 10% from recent highs. Small-cap equities, as measured by the Russell 2000, have declined almost 17% from their high in November 2024. Small-cap equities are more economically sensitive, but underperformance has been compounded by depressed earnings. Large-cap equities, as measured by the S&P 500, achieved a new all-time high in February, but have flirted with correction territory in March, down over 9%. A shift in investor sentiment continues to weigh on U.S. equities as Trump acknowledged the potential for further volatility without ruling out the possibility of a recession. Additionally, the market darlings of the past two years, the Magnificent 7, have not been immune to market volatility, as rich valuations may make these companies more susceptible in a market pullback. This cohort of companies has declined 20% since an all-time high in December 2024, as companies like Tesla have erased all of their post-election gains.

Expectations for the U.S. equity market have fallen short thus far in 2025. As the new administration navigates the path forward, the impacts of policy decisions on the economy remain uncertain, so volatility may persist. Although volatility can be painful and is likely to continue, a disciplined and diversified approach that focuses on long-term performance is still the best recipe for portfolio success.

School’s Out?

While the United States has historically prioritized public spending on education more than other developed countries, there has been a recent convergence in U.S. education expenditure as a percentage of GDP with that of other countries in the OECD, a group of mostly developed and democratic nations. Specifically, in 2000, the U.S. spent 6.1% of total GDP on education, which was notably higher than the OECD average of 4.9% at that time. That said, the U.S. figure dropped to 4.7% in 2016, which was slightly below the 4.8% OECD average that year. Based on this trend, it should come as no surprise that U.S. students are beginning to fall behind their global peers in key academic areas. To that point, U.S. K-12 students ranked 12th and 28th in science and math, respectively, out of 37 OECD member countries in 2022 according to Pew Research. The U.S. average score for math fell by a whopping 13 percentage points between 2018 and 2022 alone.

While the challenges faced by U.S. students due to the COVID-19 pandemic were significant, the fact that U.S. now spends roughly the same as other developed nations (as a percentage of GDP) has certainly contributed to these lackluster scores. Going forward, a renewed focus on education-related spending and outcomes should serve the U.S. well, as a robust public education system helps drive economic growth, stability, and innovation.