The Best and Worst of Times

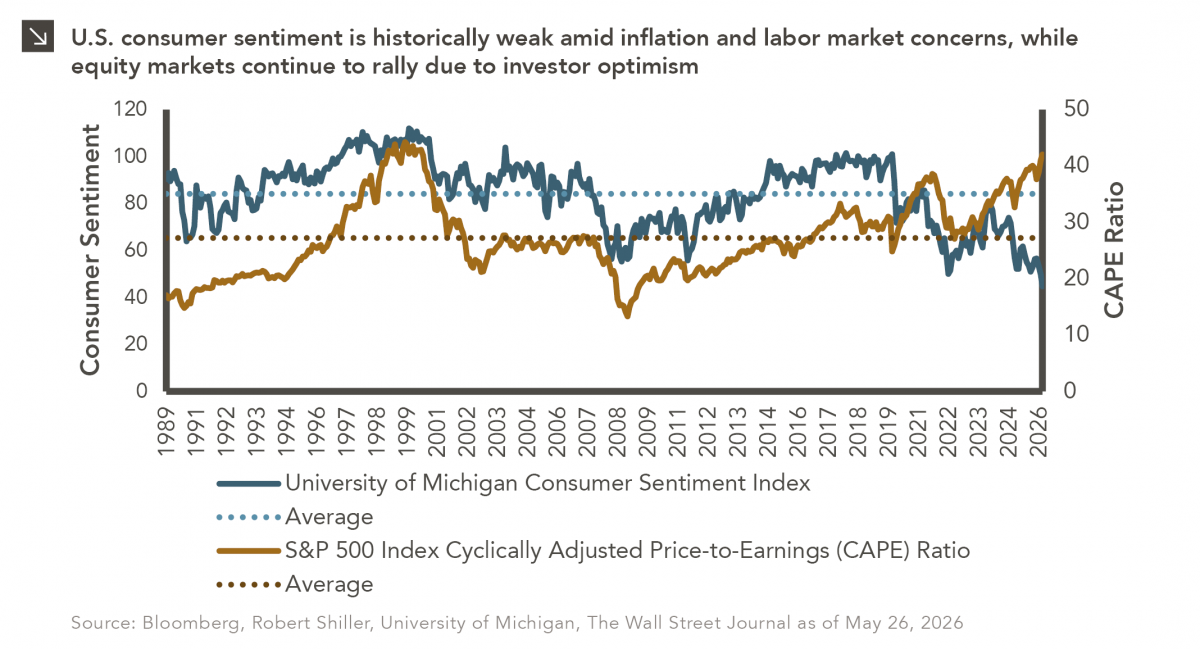
The classic novel A Tale of Two Cities by Charles Dickens begins with the line “It was the best of times, it was the worst of times…” While Dickens was describing the extreme contradictions of the late 18th century leading up to the French Revolution (i.e., comfort for the aristocracy and hardship for the poor), this line could just as easily apply to the current economic environment in the United States, which is marked by a stark divergence between consumer confidence and investor behavior. Specifically, recent University of Michigan consumer sentiment readings have fallen to some of the weakest levels in decades, reflecting persistent frustration on the part of many Americans over inflation, elevated interest rates, high gasoline prices, and job security. Consumers remain particularly sensitive to the cumulative impact of several years of higher prices, even as headline inflation has moderated from its post-pandemic peaks. Surveys from both the University of Michigan and the Conference Board suggest U.S. households are increasingly worried about future economic conditions and weakness in the labor market. At the same time, equity markets have largely shaken off these concerns given enthusiasm surrounding artificial intelligence and expectations for longer-term productivity gains. Indeed, the S&P 500 Index has notched gains of more than 17% in each of the last three full calendar years and has advanced more than 9% in 2026 as of this writing. This strong performance has led to higher equity market valuations. As can be seen in this week’s chart, the Shiller Cyclically Adjusted Price-to-Earnings (CAPE) Ratio for the S&P 500 Index, which compares prices to average inflation-adjusted earnings over the prior 10 years to smooth out short-term volatility, sits at roughly 42. This figure is well above historical average levels and signals that investors continue to pay a significant premium for future earnings growth despite weaker consumer sentiment. Many have described this dynamic as a “tale of two markets,” as investors reward companies with outsized earnings potential and the ability to generate technological disruption even as households cut back on discretionary spending and grow more cautious about the economy.

A major driver of the divergence described above is the way in which financial asset ownership is distributed in the United States. A recent estimate from the Federal Reserve indicates that the top 10% of American households own roughly 90% of all U.S. corporate equities and mutual fund shares, meaning recent market gains have created a wealth effect that continues to support spending among affluent consumers, even as lower- and middle-income households face significant pressures. This divergence also highlights the forward-looking nature of financial markets, as equity investors are often pricing in anticipated earnings growth and future monetary policy as opposed to current economic conditions. Most consumers, on the other hand, respond more directly to present-day realities such as grocery bills, gasoline prices, and the perceived stability of the labor market. Whether this sentiment gap ultimately closes due to consumer confidence that is recalled to life or equity valuations that face the guillotine of market repricing remains one of the key questions facing investors in the near term.
This Too Shall Reconstitute

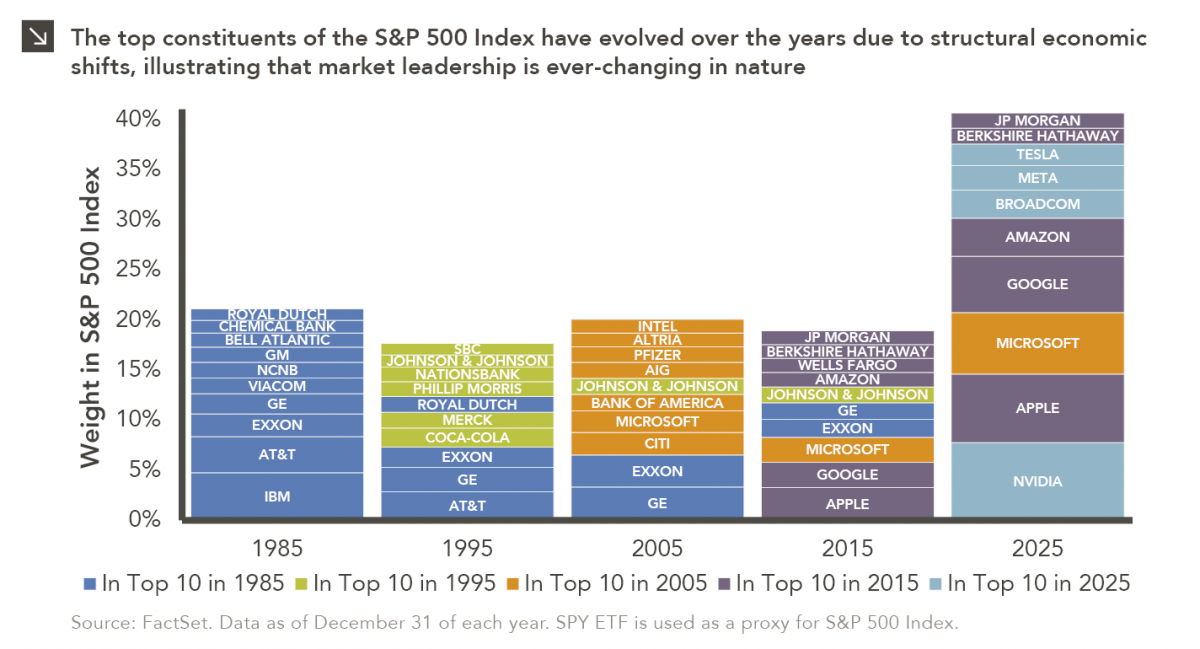
Rooted in medieval Persian Sufi thought, the adage “this too shall pass” speaks to the fleeting and impermanent nature of the human condition. For investors, this aphorism can serve as a useful framework for understanding the constantly evolving composition of the upper end of the U.S. equity market. As this week’s chart shows, the top 10 constituents of the S&P 500 Index have changed dramatically over the last 40 years, with each new decade seeing both additions to and subtractions from this basket of companies.

In 1985, the top of the S&P 500 Index was heavily weighted toward industrial conglomerates, energy producers, and legacy financial and telecommunications firms such as IBM, Exxon, AT&T, and General Electric. This composition reflected an economy still anchored in manufacturing, physical infrastructure, and regulated industries with durable but relatively slow-moving competitive dynamics. Capital intensity, domestic scale, and regulatory barriers to entry helped entrench incumbents, allowing a small set of diversified conglomerates and commodity-linked businesses to dominate equity indices. As can be observed in this week’s chart, the top 10 constituents represented roughly 21% of the S&P 500 Index in 1985. In contrast, the top 10 constituents at the end of last year represented more than 40% of the benchmark, with technology-oriented companies like NVIDIA, Apple, Microsoft, Alphabet, Amazon, and Meta topping the benchmark and accounting for an outsized share of index earnings and returns in recent years.

The transition between these two regimes did not occur abruptly but rather through decades of structural changes, including the rise of the digital economy, the decline in manufacturing’s share of GDP, and the increasing importance of intangible assets such as software, data, and intellectual property. Indeed, the 1990s and early 2000s saw the rise and consolidation of the internet economy, which led to the reshaping of information, communication, and commerce. The years following the Global Financial Crisis further accelerated the dominance of scalable, asset-light business models, while low interest rates and abundant liquidity disproportionately benefited high-growth technology firms. At the same time, several former index leaders either stagnated, were disrupted, or lost relative economic relevance, leading to a gradual but persistent turnover at the top of the index.

Against this backdrop, the current composition of the S&P 500 Index should not be viewed as fixed, but rather as a snapshot of a specific moment in time. If history is any indication, the next decade will likely bring another reshuffling of top index constituents as new technologies, industries, and business models emerge. For investors, this suggests that maintaining broadly diversified equity exposure while remaining disciplined around rebalancing is prudent, as market leadership, however dominant it appears at a given time, has historically been transient rather than permanent.

Let’s Hear It for Latin America

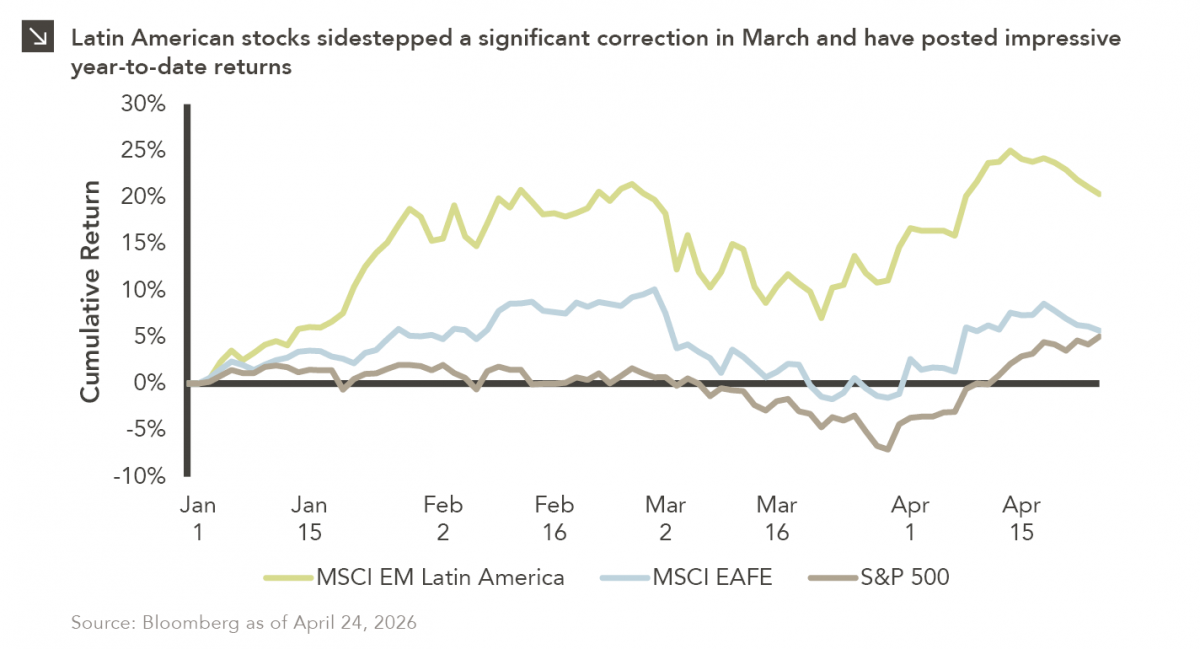
Latin American equity markets have shown remarkable strength in 2026. After a strong start to the year, the MSCI Emerging Markets Latin America Index corrected by only 4% in March amid a broad, more pronounced market pullback due in large part to the conflict in Iran. Brazil, which represents the largest economy in Latin America, was uniquely positioned to handle commodity market disruptions given its status as a net exporter of crude oil and a world leader in renewable energy utilization. Indeed, almost 90% of Brazilian electricity is generated via hydropower, wind, and solar sources, so the nation has been able to withstand recent energy shocks better than many other Western nations. The Central Bank of Brazil also cut interest rates for the first time in two years in March, though additional rate cuts that were anticipated at the start of this year are now more uncertain. Investors have also looked on Latin American financial institutions with favor in recent time, as banks across the region (e.g., Creditcorp in Peru, Itaú in Brazil, and Grupo Financiero Banorte in Mexico) are outperforming their global peers on a year-to-date basis due to attractive earnings projections. Additionally, significant foreign investment in the Brazilian economy has led to higher volumes and earnings for B3, the Brazilian stock exchange.

Global markets have stabilized in April, with the S&P 500 Index now trading near calendar year highs and developed international equities also exhibiting renewed strength. At the same time, Latin American equities have continued their upward trajectory, with the MSCI Emerging Markets Latin America Index now up more than 20% since the start of 2026. Following strong performance in 2025 and after having avoided a major drawdown in the wake of the Iran conflict, investors may want to keep a close eye on Latin American stocks as the year progresses.

We’ve Seen This Before

Diversify. Rebalance. Stay invested. Every one of these letters has concluded with that same advice in some shape or form. It’s not particularly shiny and new, but the best documented path to a successful long-term investment program. The last eight weeks are another data point in support of these practices.

In this edition:

  • Impact of U.S.–Iran conflict on oil prices, interest rates, and equity markets
  • Volatility and drawdowns in the market cycle
  • Equity market rotation
  • Magnificent 7 detraction and increased market breadth
  • Slowdown in non-U.S. equities

1Q 2026 Market Insights Webinar

This video is a recording of a live webinar held April 16 by Marquette’s research team analyzing the first quarter across the economy and various asset classes as well as themes we’ll be monitoring in the coming months.

Our quarterly Market Insights series examines the primary asset classes we cover for clients including the U.S. economy, fixed income, U.S. and non-U.S. equities, hedge funds, real assets, and private markets, with commentary by our research analysts and directors.

Featuring:
Greg Leonberger, FSA, EA, MAAA, FCA, Partner, Director of Research
James Torgerson, Senior Research Analyst
Fred Huang, Research Analyst
David Hernandez, CFA, Director of Traditional Manager Search
Evan Frazier, CFA, CAIA, Senior Research Analyst
Dennis Yu, Research Analyst
Hayley McCollum, Senior Research Analyst

Sign up for research alerts to be invited to future webinars and notified when we publish new videos.

If you have any questions, please send our team an email.


A Bug in the Software

Recent market dynamics in the software sector reflect a sharp shift in investor sentiment driven primarily by concerns that advances in artificial intelligence could fundamentally disrupt traditional software business models. Public software-linked equities have sold off broadly (even as many companies continue to deliver solid earnings) because investors are increasingly focused on long-term structural risks rather than near-term financial performance. Indeed, estimates for longer-term earnings growth for these businesses have started to decline despite stable or improving near-term outlooks, highlighting growing skepticism around the durability of pricing power, competitive moats, and growth trajectories in an AI-enabled environment. Since the end of October, the S&P North American Technology Software Index has fallen by roughly 30%. These concerns have now spread beyond equities into credit markets, where leveraged loan investors are rapidly reducing exposure to software-related borrowers. Many software loans that entered 2026 priced at or near par have since declined as investors reassess the sector’s credit risk profile, reflecting fears that AI-driven disruption could weaken cash flows and increase default risk for highly leveraged issuers. Specifically, the Morningstar LSTA U.S. Leveraged Loan Index has dropped by around 6% since the start of 2026.

This repricing across equity and credit markets underscores a key shift in sentiment. Software, long viewed as one of the most predictable and resilient sectors of the economy due to recurring revenue models and high margins, is now facing simultaneous multiple compression in equities and widening spreads in credit. While fundamentals remain relatively intact today, markets are increasingly discounting a wider range of potential outcomes for software-linked businesses, creating heightened volatility and a more selective environment in which investors are demanding clear evidence of AI resilience and sustainable competitive differentiation.

Healthcare System Operating Portfolios: Balancing Stability with Need for Growth

Healthcare systems have faced an onslaught of challenges in recent years. They had to navigate the operational and financial headwinds stemming from COVID-19, a severe labor shortage, and 2022’s double-digit drawdowns in both stocks and bonds. Since the end of 2022, global equity markets have returned more than 70% cumulatively, but a combination of portfolio draws and elevated cash expense growth has left median days cash on hand roughly flat. Going forward, balance sheet liquidity is likely to be restrained. While operating margins are improving, the appetite for capital spending remains high and the effects of the One Big Beautiful Bill Act have yet to emerge. At the same time, equities are expensive and credit spreads are tight, limiting the margin for error. Health systems need to carefully weigh the risks of a significant market decline with the need for long-term growth.

The Passive Performance Podium

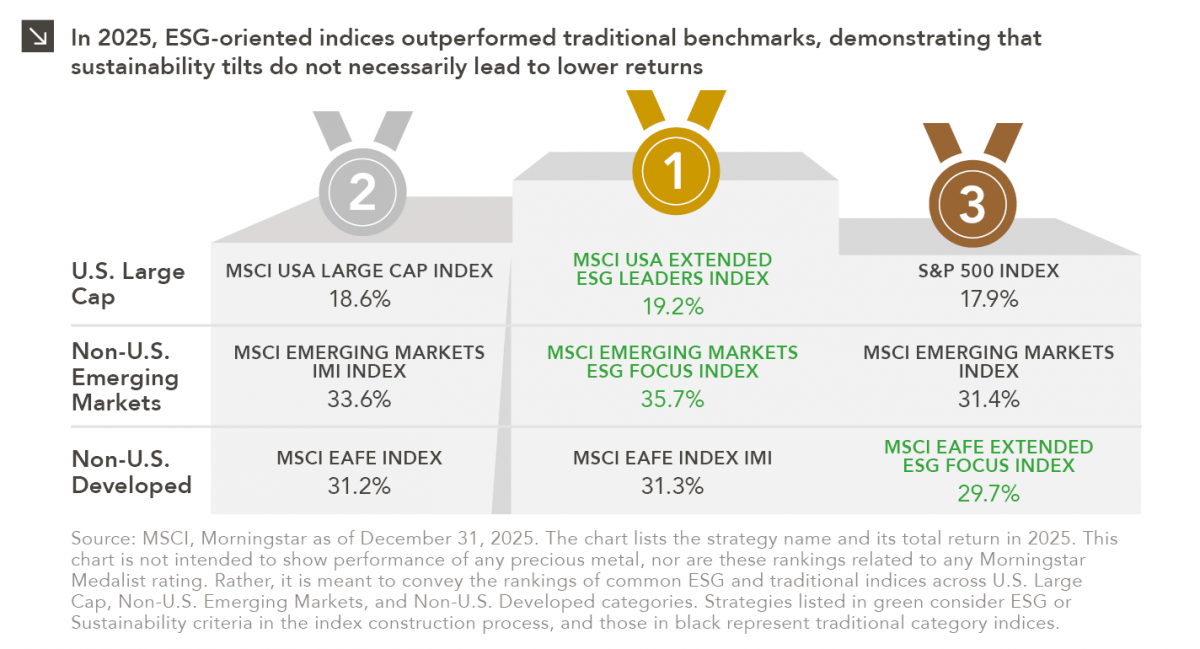
Performance is a key attribute of any investment strategy with a values-based or sustainability focus. As such, analyzing the 2025 returns of traditional indices and those of their ESG-integrated equivalents seemed like a worthwhile endeavor, especially given the 25th Winter Olympic Games currently taking place in Italy. The purpose of this assessment was to evaluate how ESG-oriented indices performed against traditional indices in the U.S. Large Cap, Emerging Markets, and Developed International equity spaces to determine the “passive performance medalists” of 2025.

Before evaluating returns, it is important to outline how ESG-oriented indices are constructed, given that a degree of tracking error is always to be expected from these benchmarks. According to MSCI, each ESG index seeks a risk and return profile that is similar to the broad market index it is designed to track, while also targeting improved sustainability characteristics and avoiding controversies. Of course, nuances exist across different flavors of sustainability indices. For instance, the “ESG Leaders” approach differs slightly from that of “ESG Focused” indices in that it overweights higher scoring ESG names against sector peers and utilizes additional screens. Key examples include the following:

  • MSCI USA Extended ESG Leaders Index: Applies exclusions related to alcohol, Arctic oil and gas production, controversial weapons, nuclear power, palm oil, thermal coal, tobacco, fossil fuel extraction, and gambling.
  • MSCI Emerging Markets ESG Focus Index and MSCI EAFE Extended ESG Focus Index: Both apply exclusions related to civilian firearms, controversial weapons, tobacco, thermal coal, and oil sands.

The time has now come to award the medals. In the U.S. Large Cap space, the ESG Leaders approach landed atop the podium in 2025, as overweight positions in best-in-class Communication Services companies proved fruitful last year. Within Emerging Markets, the MSCI EM ESG Focus Index took home gold with the highest absolute outperformance thanks to positive stock selection effects in sectors including Information Technology, Health Care, and Energy (where being underweight also contributed to excess returns). Finally, a photo finish determined the gold/silver outcome for traditional indices in the EAFE space. The MSCI EAFE ESG Index trailed the two traditional benchmarks due to its weapons-related exclusions and lower exposure to companies in construction and mining spaces, which hampered relative returns given Europe’s increased focus on defense and infrastructure.

The fact that passive ESG indices fared well outside of the EAFE space in 2025 serves as a reminder that funds that track these benchmarks may make sense for the following types of market participants:

  • Mission-aligned investors who do not see their values fully reflected in certain segments of their portfolios
  • Purpose-driven or traditional investors who may consider passive vehicles as placeholders before identifying a viable active manager

It is important to note that understanding the nuances of different ESG-focused products is crucial, as many involve exclusions, additional risk management levers, and screens that will create absolute and relative performance variability. Still, if a lesson can be learned from 2025, it is that investors can enjoy strong performance from passive equity strategies while also tilting toward securities with more sustainable characteristics.

Seventy-Five Horses and Two Pieces of Plastic

Anyone who has gone snowmobiling knows it can be simultaneously exhilarating and terrifying. Throttling across snow and through a forest powered by a 75-horsepower engine with two plastic skis to steer makes it hard to feel like one has complete control; 30 mph in the open air feels more like 100!

Nonetheless, operating a snowmobile is pretty straightforward: The throttle is a right-thumb button, the brake is a left-hand squeeze lever. Beyond those two controls, it’s up to the driver to effectively navigate the trail, with the critical concession that the terrain is out of anyone’s complete control. Which brings me to our 2026 market outlook.

The “throttles” for portfolios are the usual constituents: equities, below investment grade credit, and private markets. The “brakes” are investment grade fixed income, particularly Treasuries which can slow a portfolio’s losses if the market tumbles. The terrain is naturally the actual path that each of these asset classes will follow in 2026. Since 2022 the equity market ride has been mostly exhilarating, save for some of the terrifying moments like the market dip after Liberation Day. But that’s in the rearview mirror, and the focus is what is around the bend. Will the thrill continue, or should we ease up on the throttle?

2026 Market Preview

This video is a recording of a live webinar held January 15 by Marquette’s research team analyzing 2025 across the economy and various asset classes as well as themes we’ll be monitoring in 2026.


Our quarterly Market Insights series examines the primary asset classes we cover for clients including the U.S. economy, fixed income, U.S. and non-U.S. equities, hedge funds, real assets, and private markets, with commentary by our research analysts and directors.

Featuring:
Greg Leonberger, FSA, EA, MAAA, FCA, Partner, Director of Research
Frank Valle, CFA, CAIA, Associate Director of Fixed Income
James Torgerson, Senior Research Analyst
Catherine Hillier, Senior Research Analyst
David Hernandez, CFA, Director of Traditional Manager Search
Evan Frazier, CFA, CAIA, Senior Research Analyst
Dennis Yu, Research Analyst
Amy Miller, Associate Director of Private Equity
Chad Sheaffer, CFA, CAIA, Associate Director of Private Credit

Sign up for research alerts to be invited to future webinars and notified when we publish new videos.

If you have any questions, please send our team an email.