10.08.2026
3Q 2026 Market Insights
This video is a recording of a live webinar held October 22 by Marquette’s research team analyzing the third quarter…


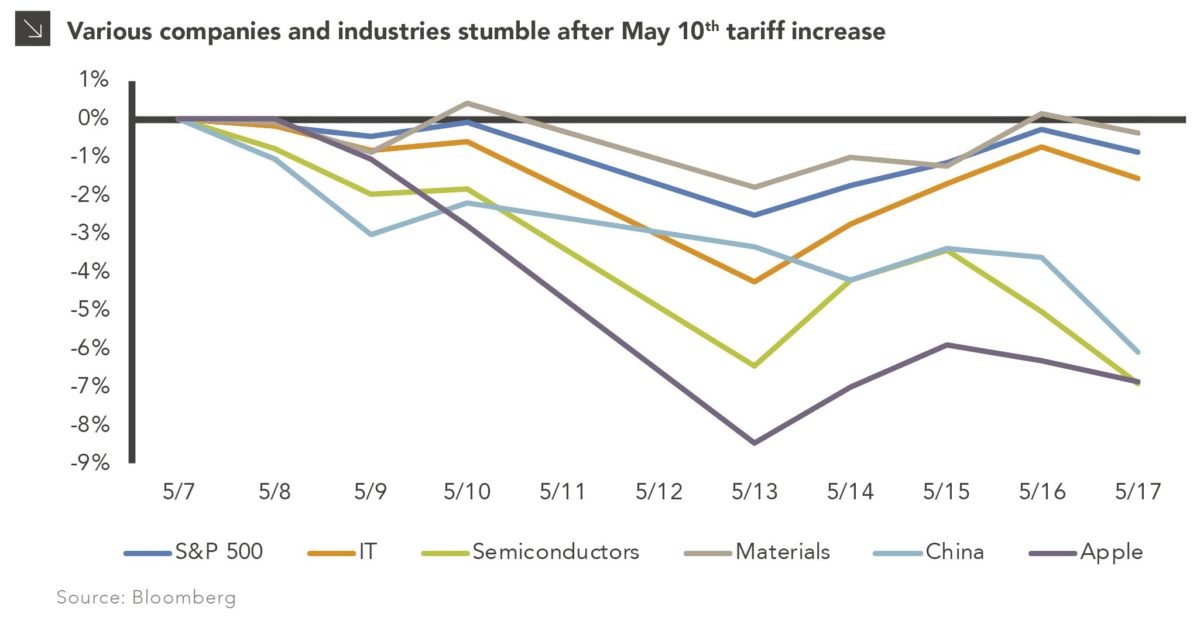
On May 10th, the United States increased tariffs from 10% to 25% on $200 billion of Chinese imports after trade talks broke down. The increase was initially planned for January 1, 2019, but the U.S. delayed the tariffs in order to see if a resolution could be reached by May 1st. China retaliated on May 13th with an increase in tariffs on $60 billion on American goods, effective June 1st.
Since the announcement, U.S. and Chinese equity markets have been down 0.9% and 6.1% through May 17th. In particular, there are a number of companies and industries caught in trade crosshairs:
Fortunately, the United States has taken some steps to lessen the blow of tariffs. First, the Trump administration delayed making a final decision on whether to impose tariffs on auto imports from the European Union and Japan. Second, the administration reached a deal with Canada and Mexico to end U.S. and retaliatory tariffs on steel and aluminum. This removes a major roadblock in the possible passage of the USMCA trade agreement, which would replace NAFTA, by Congress. However, our trade with China is greater than our trade with Canada or Mexico.
Recently, consumer confidence hit a 15-year high, but the survey was taken before the May 8th trade announcement. While the Street is crossing its fingers that a deal can be reached by the G20 summit in late June, we are more concerned with how a prolonged dispute can affect business investment and eventually, consumer confidence.
Print PDF > Upping the Trade Ante: The U.S. Increases Tariffs on China
The opinions expressed herein are those of Marquette Associates, Inc. (“Marquette”), and are subject to change without notice. This material is not financial advice or an offer to purchase or sell any product. Marquette reserves the right to modify its current investment strategies and techniques based on changing market dynamics or client needs.
The opinions expressed herein are those of Marquette Associates, Inc. (“Marquette”), and are subject to change without notice. This material is not financial advice or an offer to purchase or sell any product. Marquette reserves the right to modify its current investment strategies and techniques based on changing market dynamics or client needs.

10.08.2026
This video is a recording of a live webinar held October 22 by Marquette’s research team analyzing the third quarter…

10.22.2026
Anyone who has run a marathon knows the last six miles are brutal — no matter how well the first…

10.19.2026
Since 1980, the S&P 500 Index has generally performed well in the weeks surrounding U.S. midterm elections. Specifically, the index…

10.12.2026
This week’s chart highlights the accelerating growth of electricity demand in the U.S., which has been driven primarily by the…

10.05.2026
For investors, the spookiest thing about October might not be the ghosts and monsters that are bound to show up…

09.28.2026
The phrase “expectations of higher inflation” has become a staple in financial news to explain the increase in nominal U.S….
Research alerts keep you updated on our latest research publications. Simply enter your contact information, choose the research alerts you would like to receive and click Subscribe. Alerts will be sent as research is published.
We respect your privacy. We will never share or sell your information.
If you have questions or need further information, please contact us directly and we will respond to your inquiry within 24 hours.
Contact Us >