Catherine Hillier
Senior Research Analyst


Equity market strength through the third quarter continues to challenge the common expectation going into the year. Cumulatively through September 30, the slowdown many investors anticipated has been averted thus far as the strength in certain segments of the market has more than offset the weakness in others. Following the strength of value equities — with Energy the lone positive sector in 2022 — markets experienced a shift in leadership to begin 2023. Companies that were challenged by supply chain issues and wage pressures rebounded to begin the year, primarily within growth-oriented sectors including Communication Services, Information Technology, and Consumer Discretionary. Overall, markets were strong through the first nine months of the year, as the S&P 500 rose 13.1%. However, September — historically the worst month of the year for equity markets — saw a somewhat unsurprising pullback. As we enter the final quarter of the year, we feel it is important to examine the underlying market dynamics driving performance and highlight the risks of a narrow market as well as the opportunities available on the sidelines.
Read > U.S. Equities: Surprising Strength Gives Way to Macro Risks
The opinions expressed herein are those of Marquette Associates, Inc. (“Marquette”), and are subject to change without notice. This material is not financial advice or an offer to purchase or sell any product. Marquette reserves the right to modify its current investment strategies and techniques based on changing market dynamics or client needs.
10.26.2026
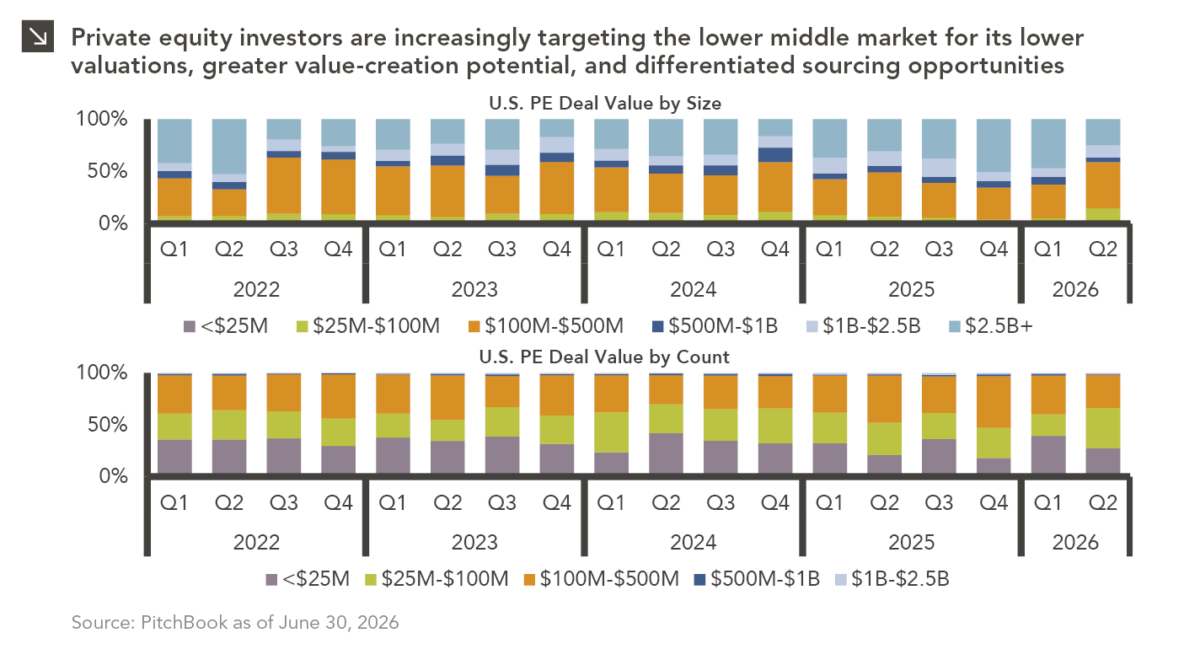
Private equity activity is increasingly shifting toward smaller transactions, with total deal value for transactions of $100 million or less…

10.08.2026
This video is a recording of a live webinar held October 22 by Marquette’s research team analyzing the third quarter…
10.22.2026
Anyone who has run a marathon knows the last six miles are brutal — no matter how well the first…
10.19.2026
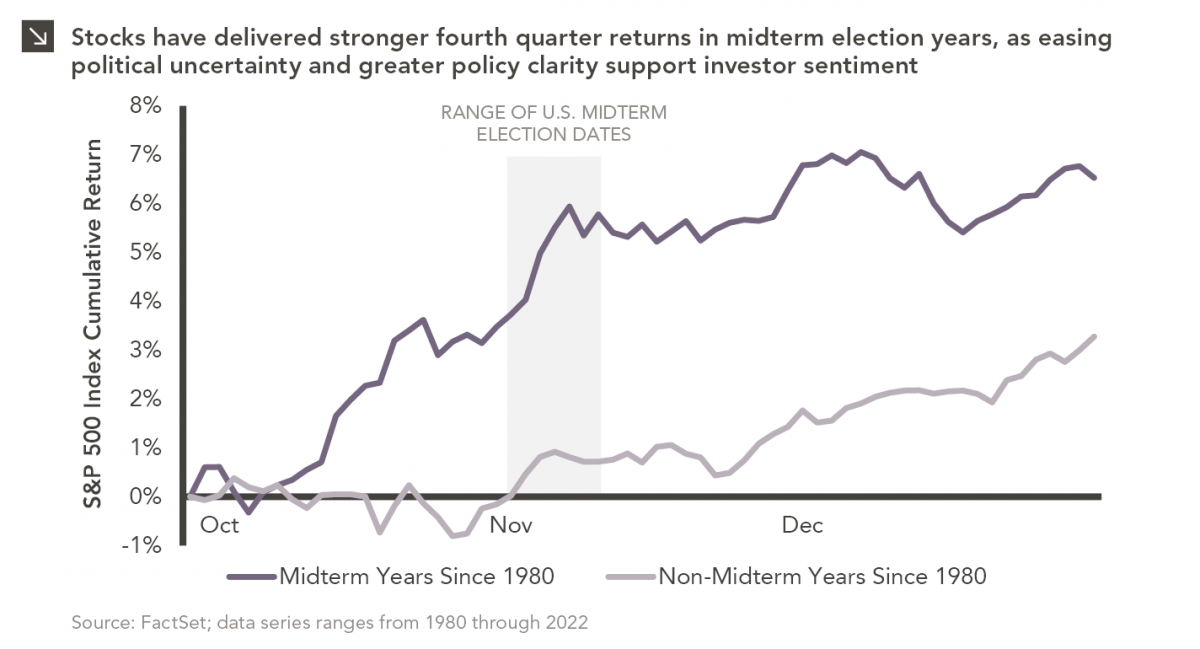
Since 1980, the S&P 500 Index has generally performed well in the weeks surrounding U.S. midterm elections. Specifically, the index…
10.05.2026
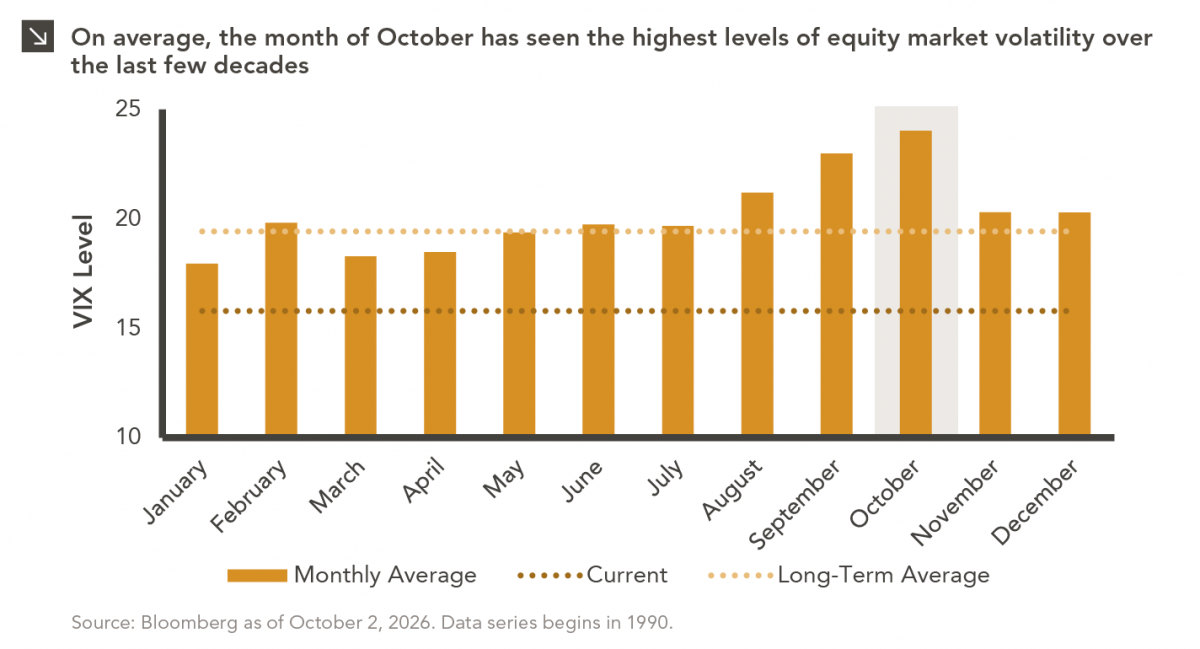
For investors, the spookiest thing about October might not be the ghosts and monsters that are bound to show up…
09.28.2026
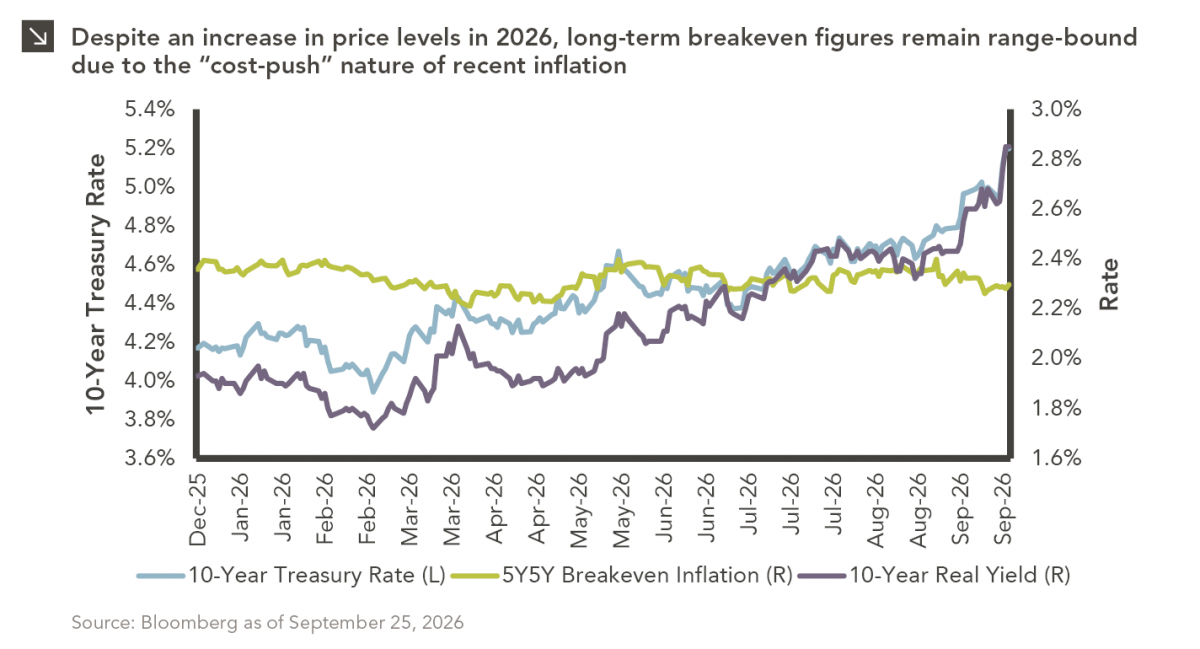
The phrase “expectations of higher inflation” has become a staple in financial news to explain the increase in nominal U.S….
Research alerts keep you updated on our latest research publications. Simply enter your contact information, choose the research alerts you would like to receive and click Subscribe. Alerts will be sent as research is published.
We respect your privacy. We will never share or sell your information.
If you have questions or need further information, please contact us directly and we will respond to your inquiry within 24 hours.
Contact Us >