07.24.2026
2026 Halftime Market Insights
This video is a recording of a live webinar held July 23 by Marquette’s research team analyzing the first half…
Flash talk by Kelli Schrade, CAIA, from Marquette’s 2015 Investment Symposium on hiring and firing investment managers — and why investors get it wrong.
The opinions expressed herein are those of Marquette Associates, Inc. (“Marquette”), and are subject to change without notice. This material is not financial advice or an offer to purchase or sell any product. Marquette reserves the right to modify its current investment strategies and techniques based on changing market dynamics or client needs.

07.24.2026
This video is a recording of a live webinar held July 23 by Marquette’s research team analyzing the first half…

04.02.2026
This video is a recording of a live webinar held April 16 by Marquette’s research team analyzing the first quarter…

01.07.2026
This video is a recording of a live webinar held January 15 by Marquette’s research team analyzing 2025 across the…
01.14.2026
Contrary to widespread belief, fixed income aggregate strategies offer a continuum of active risk and return profiles. While aggregate strategies…
12.10.2025
At the start of 2025, very few could have predicted the wild ride that awaited equity markets. After a volatile…
11.03.2025
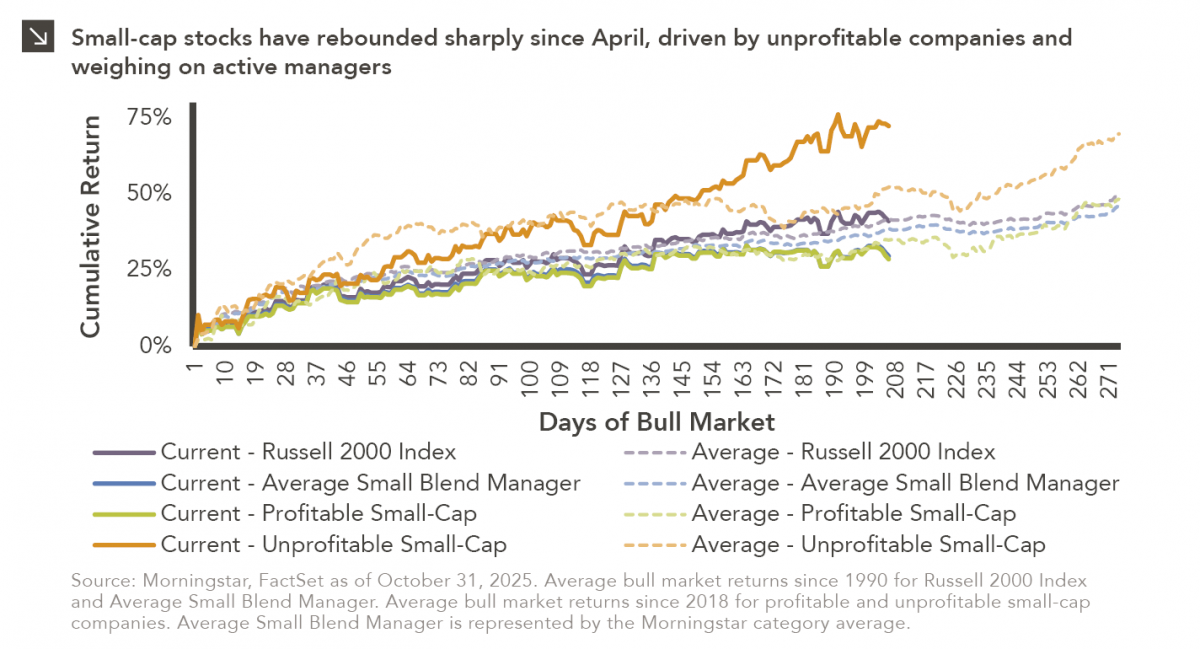
Small-cap equities are in a prolonged period of underperformance relative to large-cap stocks, but this trend has shown early signs…
Research alerts keep you updated on our latest research publications. Simply enter your contact information, choose the research alerts you would like to receive and click Subscribe. Alerts will be sent as research is published.
We respect your privacy. We will never share or sell your information.
If you have questions or need further information, please contact us directly and we will respond to your inquiry within 24 hours.
Contact Us >