07.24.2026
2026 Halftime Market Insights
This video is a recording of a live webinar held July 23 by Marquette’s research team analyzing the first half…
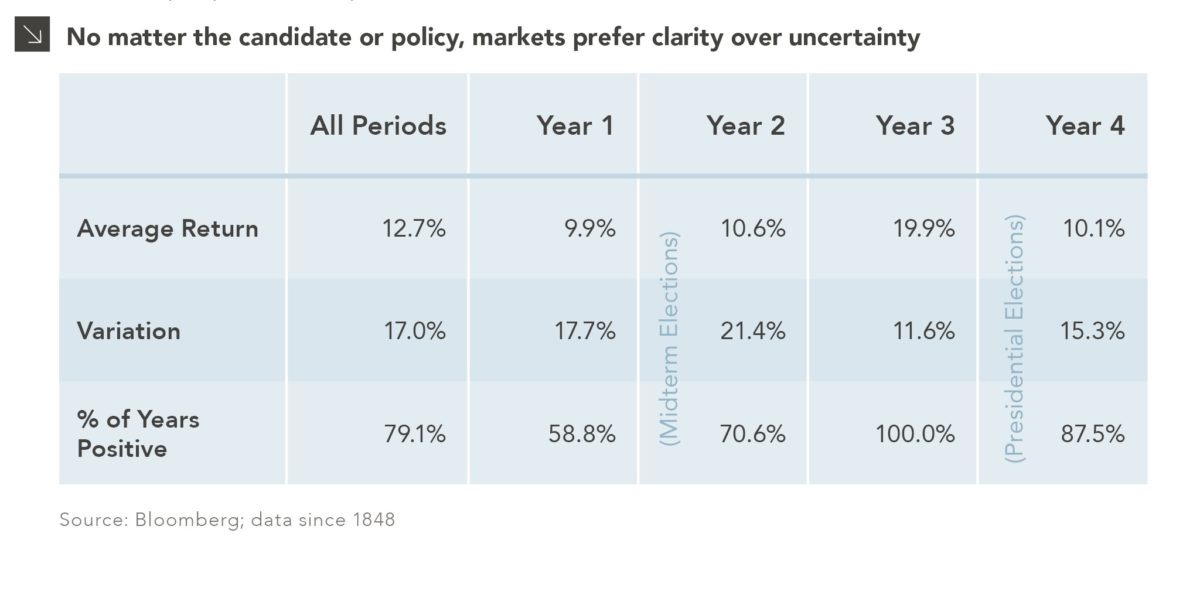
Prior to each presidential election, there is inevitable talk about market reactions to candidates and how policy changes could impact investors. As shown in the table, election years tend to exhibit more muted returns (as measured by the S&P 500 index) and greater volatility compared to the years leading into the presidential election. Year-to-date, 2019 has continued the Year 3 trend of strong performance, but if history is any indication, the 2020 outlook is less optimistic.
When it comes to Republicans vs. Democrats, political pundits often try to show one is better than the other for equity market returns. The reality, however, is that there isn’t enough of a sample size to draw any meaningful conclusions about parties, given the number of combinations of who controls the Presidency, Senate, and House of Representatives. Even in the case of 2016 with Trump’s unexpected win, markets initially sold off but quickly rebounded to their previous levels. No matter the candidate or the policy, markets care most about clarity and dislike uncertainty. As a result, we are expecting greater volatility over the next 12 months as we head into the 2020 presidential election. While the election will certainly not be the sole driver of market volatility, it will undoubtedly contribute to further uncertainty over the coming months.
Print PDF > What Does an Election Year Mean for Equity Investors?
The opinions expressed herein are those of Marquette Associates, Inc. (“Marquette”), and are subject to change without notice. This material is not financial advice or an offer to purchase or sell any product. Marquette reserves the right to modify its current investment strategies and techniques based on changing market dynamics or client needs.

07.24.2026
This video is a recording of a live webinar held July 23 by Marquette’s research team analyzing the first half…
07.22.2026
The usual midyear version of these letters has touched on year-to-date performance as well as the most influential macroeconomic and…

07.20.2026
Our most recent Chart of the Week publication discussed how the AI investment opportunity has expanded beyond…

07.13.2026
One of the enduring lessons of the California Gold Rush is that the greatest fortunes were often made not by…

07.06.2026
Since traditional exit routes have remained constrained in recent years due to higher interest rates, valuation gaps, and a subdued…

06.29.2026
This week’s chart highlights the varying return profiles across key infrastructure sectors by illustrating the split between income and capital…
Research alerts keep you updated on our latest research publications. Simply enter your contact information, choose the research alerts you would like to receive and click Subscribe. Alerts will be sent as research is published.
We respect your privacy. We will never share or sell your information.
If you have questions or need further information, please contact us directly and we will respond to your inquiry within 24 hours.
Contact Us >