10.08.2026
3Q 2026 Market Insights
This video is a recording of a live webinar held October 22 by Marquette’s research team analyzing the third quarter…


This week’s chart examines forward-looking returns for private real estate based on historical spreads to the 10-Year Treasury Yield and the NCREIF-ODCE Index (proxy for core private real estate). Real estate valuations (spread-to-Treasuries) are currently above 300 bps as a result of COVID-19. Spreads of this magnitude have only been seen four times, each of which has been followed by strong 3- and 5-year returns. For example, during the Global Financial Crisis, real estate spreads-to-Treasuries surpassed 300 bps in the fourth quarter of 2009 which were followed by 12.2% and 12.4% returns for the NCREIF-ODCE Index in the subsequent 3 and 5-year periods, respectively.
Though the impacts from COVID-19 have not yet been fully felt in the private real estate market, it is clear that challenges lie ahead, particularly in the sectors that have been hit the hardest. For example, assets with short lease durations and heavier operating business components, such as hospitality (daily), and co-working office (monthly), as well as assets that rely on foot traffic, such as entertainment, food & beverage, and destination retail will be more affected by the pandemic. Further complicating matters, the lack of transaction volume, comparable sales, leases, and loan originations have made it nearly impossible for appraisers to adjust valuations at this point in time.
Beyond the aforementioned troubled sectors, the impacts from COVID-19 will ultimately vary by property type, geography, and risk profile. The following table highlights the potential near-term and long-term impacts of each property sector:
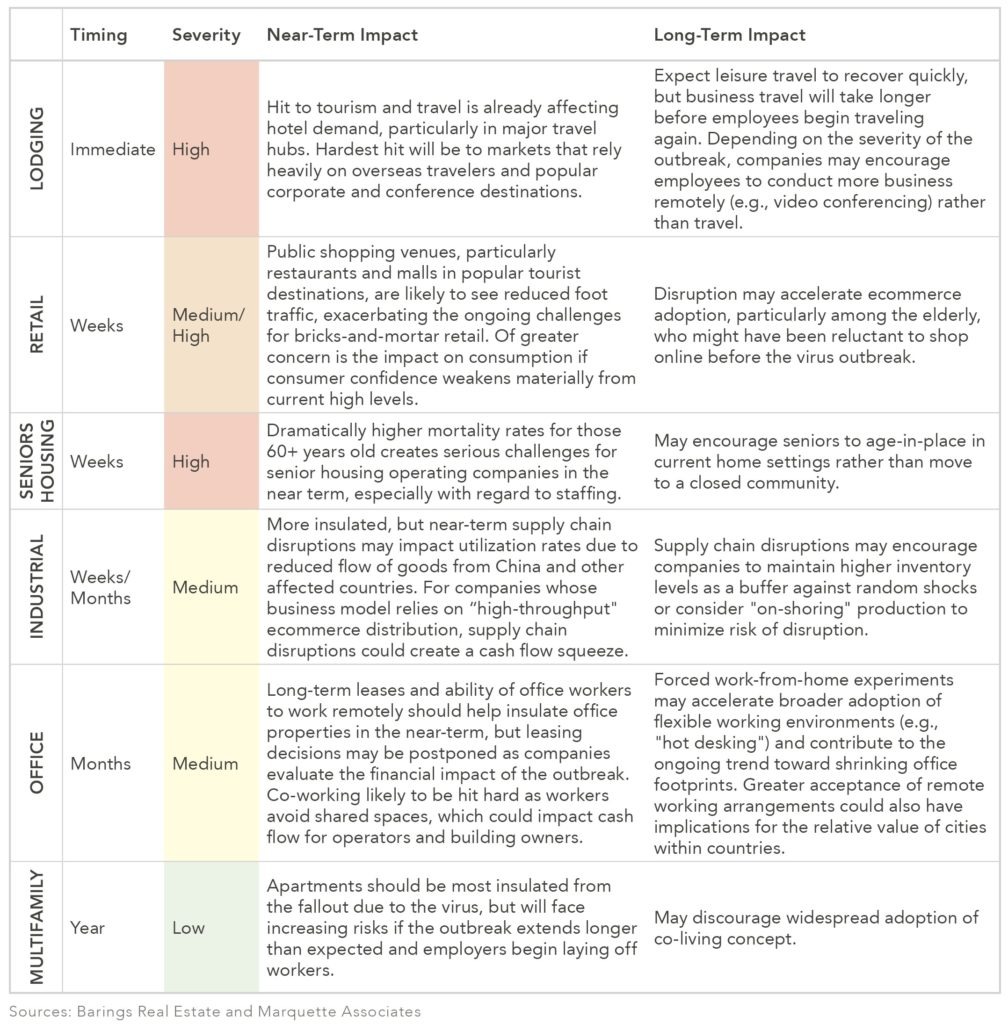
While global growth is being impacted in the near-term, we still expect a recovery to take hold once the disruption fades; we still maintain the view that the recovery is delayed, not derailed. However, the true impact of this on real estate returns will not be known for a while. Although longer-term forward-looking returns appear promising at this point, there is a relatively high degree of uncertainty because the ultimate impact on the aforementioned sectors (which should be the biggest headwind for real estate) will remain unknown until the coronavirus outbreak is contained and the economy begins to function at a normal level again.
Print PDF > What Does the Coronavirus Pandemic Mean for Future Real Estate Returns?
The opinions expressed herein are those of Marquette Associates, Inc. (“Marquette”), and are subject to change without notice. This material is not financial advice or an offer to purchase or sell any product. Marquette reserves the right to modify its current investment strategies and techniques based on changing market dynamics or client needs.

10.08.2026
This video is a recording of a live webinar held October 22 by Marquette’s research team analyzing the third quarter…

10.22.2026
Anyone who has run a marathon knows the last six miles are brutal — no matter how well the first…

10.19.2026
Since 1980, the S&P 500 Index has generally performed well in the weeks surrounding U.S. midterm elections. Specifically, the index…

10.12.2026
This week’s chart highlights the accelerating growth of electricity demand in the U.S., which has been driven primarily by the…

10.05.2026
For investors, the spookiest thing about October might not be the ghosts and monsters that are bound to show up…

09.28.2026
The phrase “expectations of higher inflation” has become a staple in financial news to explain the increase in nominal U.S….
Research alerts keep you updated on our latest research publications. Simply enter your contact information, choose the research alerts you would like to receive and click Subscribe. Alerts will be sent as research is published.
We respect your privacy. We will never share or sell your information.
If you have questions or need further information, please contact us directly and we will respond to your inquiry within 24 hours.
Contact Us >