David Hernandez, CFA
Director of Traditional Manager Search


This week we examine when the unemployment rate may hit the Fed’s 6.5% target, courtesy of the Federal Reserve Bank of Atlanta’s Jobs Calculator™. The chart above shows the average monthly change in payroll employment needed for the unemployment rate to hit 6.5% at the listed months. For example, if the average monthly change is 190,000, we can expect to hit the Fed’s target around October 2014. These calculations assume the current labor participation rate of 63.2% remains constant.
Over the last 24 months the average number of new net jobs created each month in the U.S. has been 181,750. If that number persists, the Fed’s target of 6.5% will be reached in December of 2014 at which point investors may prepare for an increase in the Fed Funds rate. However, the unemployment rate does not exclusively capture labor market conditions and the Fed will undoubtedly look to other metrics including the labor force participation rate. Since 2008 the participation rate has fallen from 66.2% to 63.2%, a 35 year low. This unparalleled drop has unfortunately been a major driver in the unemployment rate’s downward movement and clouded labor market conditions. For this reason among others, economists have begun questioning whether the Fed will lower its target for unemployment and investors would be wise to not solely rely on the headline number to determine the health of the labor market.

The opinions expressed herein are those of Marquette Associates, Inc. (“Marquette”), and are subject to change without notice. This material is not financial advice or an offer to purchase or sell any product. Marquette reserves the right to modify its current investment strategies and techniques based on changing market dynamics or client needs.
11.09.2026
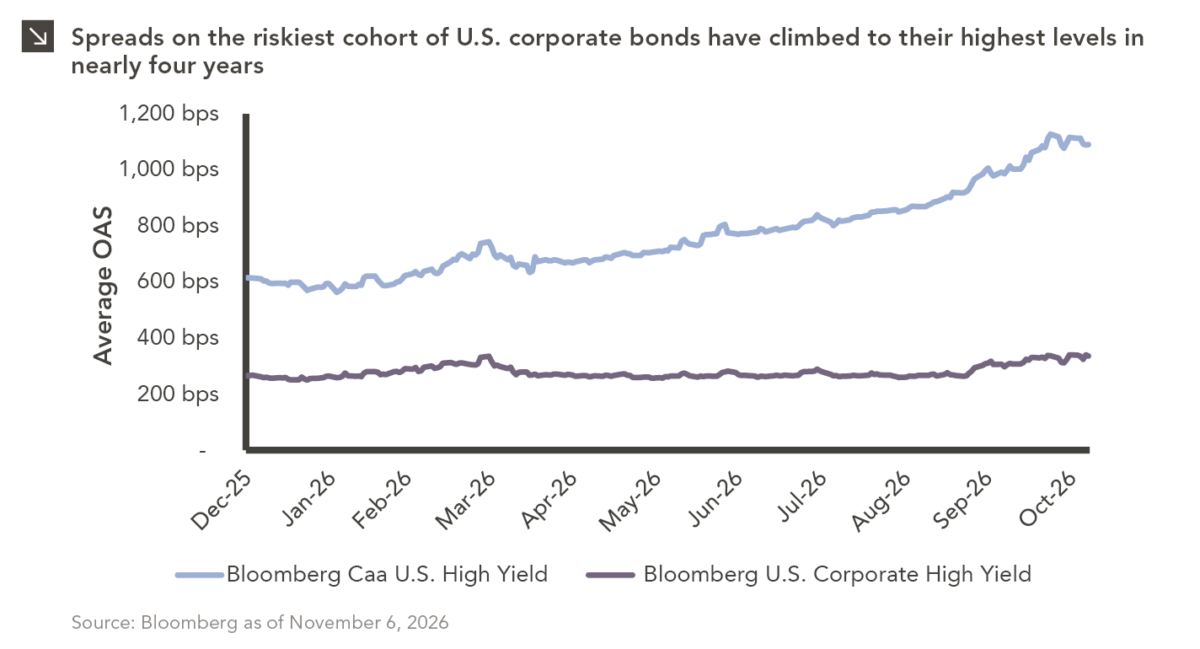
The U.S. distressed debt market is showing increasingly pronounced signs of stress. As of this writing, option-adjusted spreads on CCC-rated…
11.02.2026
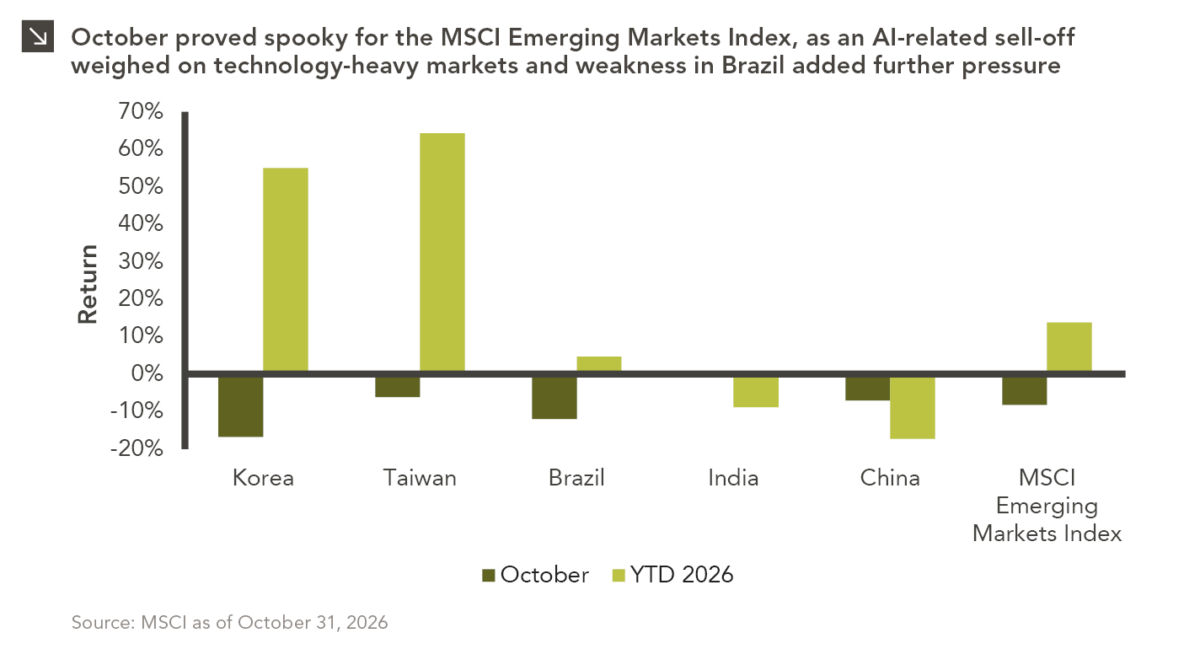
Emerging markets faced a challenging October, with the space declining by around 8.3% amid renewed concerns over the sustainability of…
10.26.2026
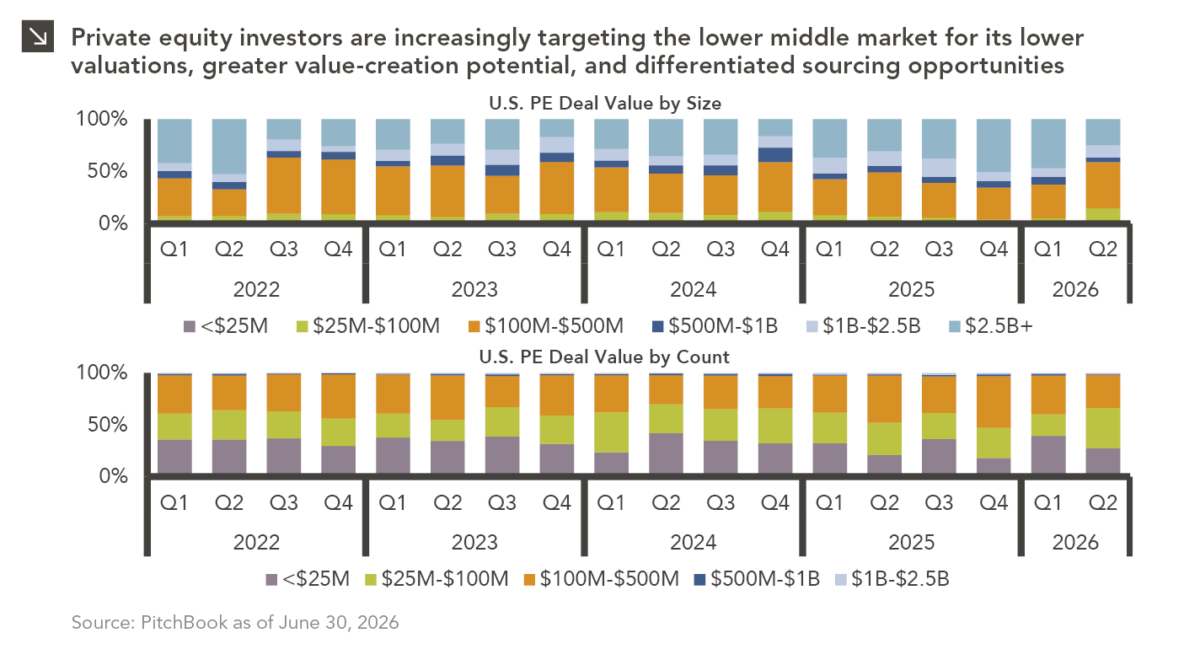
Private equity activity is increasingly shifting toward smaller transactions, with total deal value for transactions of $100 million or less…

10.08.2026
This video is a recording of a live webinar held October 22 by Marquette’s research team analyzing the third quarter…

10.22.2026
Anyone who has run a marathon knows the last six miles are brutal — no matter how well the first…
10.19.2026
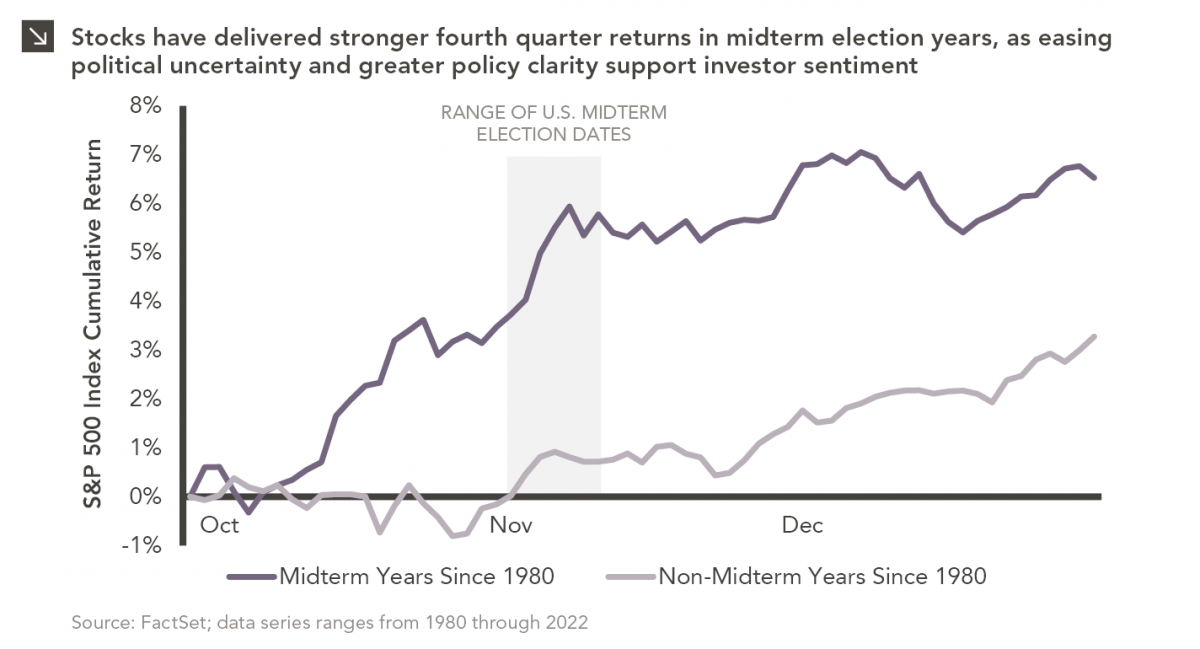
Since 1980, the S&P 500 Index has generally performed well in the weeks surrounding U.S. midterm elections. Specifically, the index…
Research alerts keep you updated on our latest research publications. Simply enter your contact information, choose the research alerts you would like to receive and click Subscribe. Alerts will be sent as research is published.
We respect your privacy. We will never share or sell your information.
If you have questions or need further information, please contact us directly and we will respond to your inquiry within 24 hours.
Contact Us >