10.08.2026
3Q 2026 Market Insights
This video is a recording of a live webinar held October 22 by Marquette’s research team analyzing the third quarter…


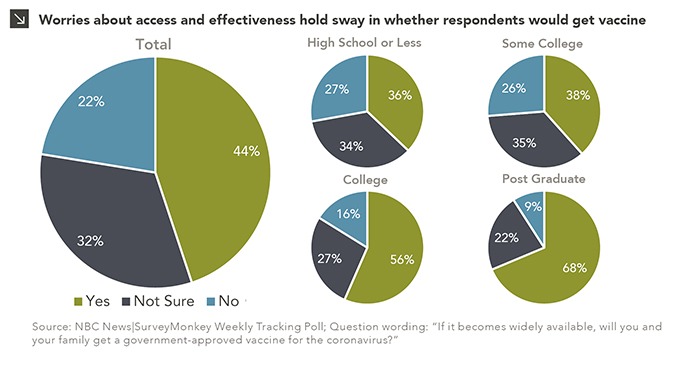
Simmering in the background of the presidential race and stimulus talks remains a crucial step towards fully re-opening the country: vaccine progress. Many experts view the development of a vaccine as the key to finally ending the battle against COVID-19. With a commercially available vaccine anticipated as early as April of 2021, it seemed that we were drawing nearer to the end of restrictions on large gatherings. People would be able to attend sporting events, weddings, and graduations again in a return to more normal life. However, in a startling recent poll of over 34,000 people regarding their interest in receiving a government-approved vaccine, over half said that they would not or are not sure that they would want to receive the vaccine.
The stark difference in responses seems to correlate with education level, as shown in the charts above. There is a significant increase in wanting to receive the vaccine on behalf of people whose education includes a college degree. For education levels below college, the results were much more mixed about receptivity to a vaccine. The most commonly cited reservations were accessibility (cost, wait time, proximity of distribution center/medical office) and effectiveness. Although this was just one poll, it appears that the release of a vaccine may not completely stem the pandemic unless there is a dramatic reversal in vaccine sentiment over the coming months.
Print PDF > Will a Vaccine Be the End of COVID-19?
The opinions expressed herein are those of Marquette Associates, Inc. (“Marquette”), and are subject to change without notice. This material is not financial advice or an offer to purchase or sell any product. Marquette reserves the right to modify its current investment strategies and techniques based on changing market dynamics or client needs.

10.08.2026
This video is a recording of a live webinar held October 22 by Marquette’s research team analyzing the third quarter…

10.22.2026
Anyone who has run a marathon knows the last six miles are brutal — no matter how well the first…

10.19.2026
Since 1980, the S&P 500 Index has generally performed well in the weeks surrounding U.S. midterm elections. Specifically, the index…

10.12.2026
This week’s chart highlights the accelerating growth of electricity demand in the U.S., which has been driven primarily by the…

10.05.2026
For investors, the spookiest thing about October might not be the ghosts and monsters that are bound to show up…

09.28.2026
The phrase “expectations of higher inflation” has become a staple in financial news to explain the increase in nominal U.S….
Research alerts keep you updated on our latest research publications. Simply enter your contact information, choose the research alerts you would like to receive and click Subscribe. Alerts will be sent as research is published.
We respect your privacy. We will never share or sell your information.
If you have questions or need further information, please contact us directly and we will respond to your inquiry within 24 hours.
Contact Us >