10.26.2026
Smaller Deals, Larger Appeal
Private equity activity is increasingly shifting toward smaller transactions, with total deal value for transactions of $100 million or less…


As we head into the 2020 year-end holiday season on the heels of positive vaccine news and an all but formally concluded presidential election, investors are turning their attention to what the state of the world economy and financial markets might look like as we potentially return to normal in 2021 and beyond. One key question being asked is where interest rates and bond yields might be headed.
In this newsletter, we explore why we are in such an ultra-low yield environment as well as what key structural transformations need to take place for rates to meaningfully rise to higher levels. Last, we devise a recommended plan of action for how asset owners can address this persistent ultra-low yield environment — even after a COVID recovery — in order to achieve return or volatility targets.
Read > Why Will Yields Remain Low After COVID and What Can Investors Do
About It?
The opinions expressed herein are those of Marquette Associates, Inc. (“Marquette”), and are subject to change without notice. This material is not financial advice or an offer to purchase or sell any product. Marquette reserves the right to modify its current investment strategies and techniques based on changing market dynamics or client needs.

10.26.2026
Private equity activity is increasingly shifting toward smaller transactions, with total deal value for transactions of $100 million or less…

10.08.2026
This video is a recording of a live webinar held October 22 by Marquette’s research team analyzing the third quarter…
10.22.2026
Anyone who has run a marathon knows the last six miles are brutal — no matter how well the first…

10.19.2026
Since 1980, the S&P 500 Index has generally performed well in the weeks surrounding U.S. midterm elections. Specifically, the index…
10.05.2026
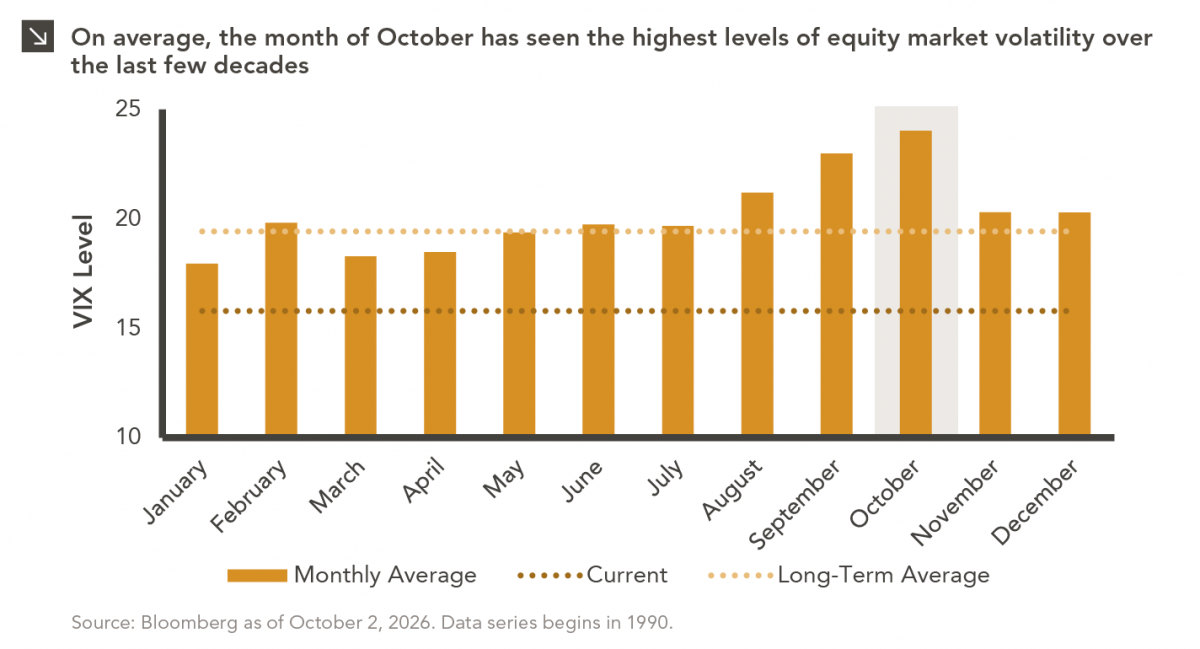
For investors, the spookiest thing about October might not be the ghosts and monsters that are bound to show up…
09.28.2026
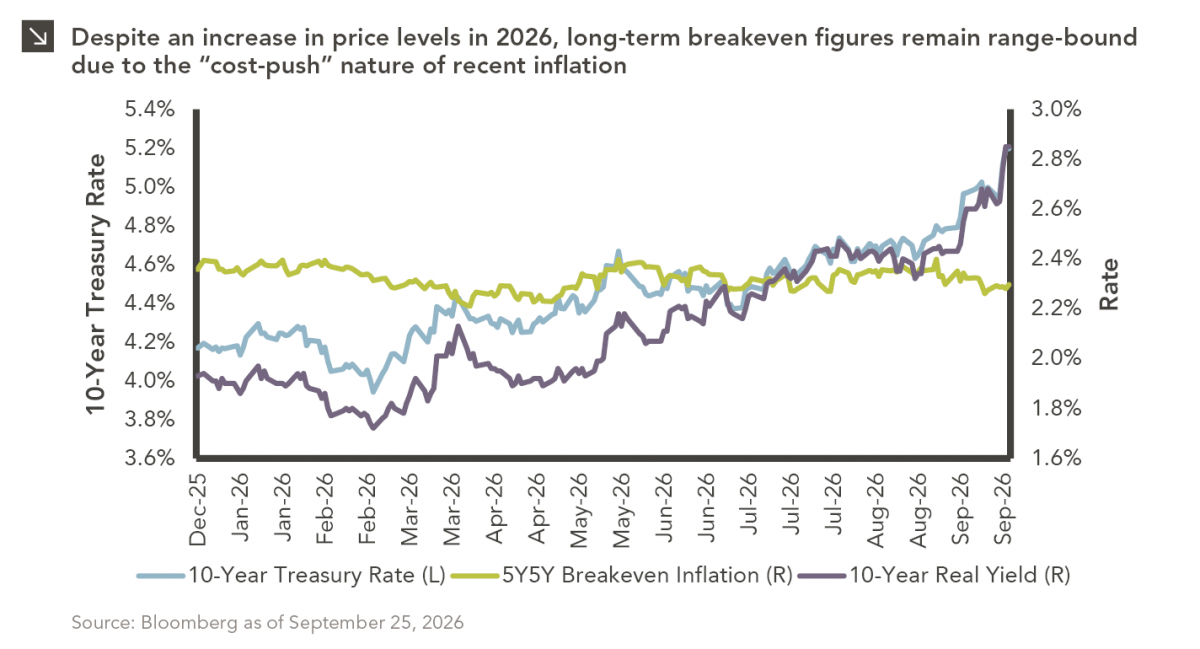
The phrase “expectations of higher inflation” has become a staple in financial news to explain the increase in nominal U.S….
Research alerts keep you updated on our latest research publications. Simply enter your contact information, choose the research alerts you would like to receive and click Subscribe. Alerts will be sent as research is published.
We respect your privacy. We will never share or sell your information.
If you have questions or need further information, please contact us directly and we will respond to your inquiry within 24 hours.
Contact Us >