Hayley McCollum
Senior Research Analyst


After an incredibly strong run in venture capital, public market weakness is beginning to show through in the VC space, with comparisons to the dot-com era emerging. The venture capital ecosystem, however, remains steadfast in the opportunity set due to the advancement of technology and the dry powder available. As of September 30, 2022, global venture capital fundraising activity reached $224 billion, approaching the $265 billion raised in 2021 and not far off the record $298 billion raised in 2018.¹
Technology is almost synonymous with venture capital. Through the third quarter, technology made up 85% of the U.S. deal value in 2022. In the 2000s, the technology space was less developed than it is today. Venture technology investing was mostly in hardware and telecom. Today, the focus is largely on cloud-based software. The speed at which companies across sectors are adopting technology has increased, leading to a lot of white space for innovation. Furthering momentum, COVID-19 pulled forward adoption trends, pushing companies to embrace technology in new ways. Industries like banking, agriculture, and consumer goods, which have historically been more technology-resistant, were forced to pivot in order to survive. Estimates suggest the pandemic accelerated digital adoption trends in these mega industries by 5–10 years.
The amount of dry powder in venture capital today also gives the asset class some stability. Dry powder levels are hitting all-time highs — $585 billion as of March 31, 2022 — providing a buffer to ensure there is still capital available for startups in the coming years. Ongoing investment in VC companies allows innovators to continue innovating, even in times of market stress.
While there may be some similarities with the dot-com period, there are many differences that could support a quicker recovery than the industry saw then. While we cannot predict the future, we can remain disciplined in our due diligence and look to align our clients with the VC managers that should be best positioned to navigate the volatility.
Print PDF > The Adventures in Venture: Navigating the Current VC Environment
¹Pitchbook

The opinions expressed herein are those of Marquette Associates, Inc. (“Marquette”), and are subject to change without notice. This material is not financial advice or an offer to purchase or sell any product. Marquette reserves the right to modify its current investment strategies and techniques based on changing market dynamics or client needs.

08.17.2026
As a college football player struggling to put on mass, the “supersizing” deal at McDonald’s was hard to beat. For…

08.10.2026
After reaching nearly ¥164 per dollar, its weakest level in roughly four decades, the yen had become a source of…

08.03.2026
In the cinematic masterpiece Rocky IV, Rocky gets dazed by his opponent, Captain Ivan Drago, and complains that he sees…
07.27.2026
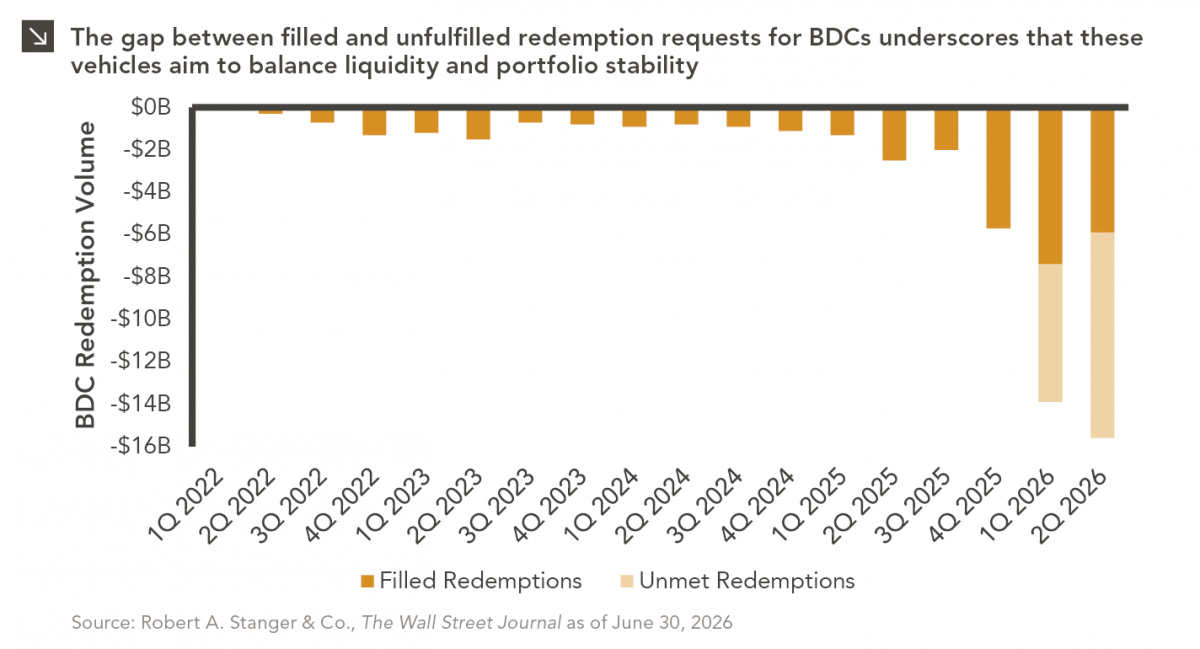
The rapid growth of non-traded business development companies (BDCs), which are investment vehicles that pool investor capital to make loans…

07.24.2026
This video is a recording of a live webinar held July 23 by Marquette’s research team analyzing the first half…

07.22.2026
The usual midyear version of these letters has touched on year-to-date performance as well as the most influential macroeconomic and…
Research alerts keep you updated on our latest research publications. Simply enter your contact information, choose the research alerts you would like to receive and click Subscribe. Alerts will be sent as research is published.
We respect your privacy. We will never share or sell your information.
If you have questions or need further information, please contact us directly and we will respond to your inquiry within 24 hours.
Contact Us >