Cassie Nestor
Research Associate
Get to Know Cassie
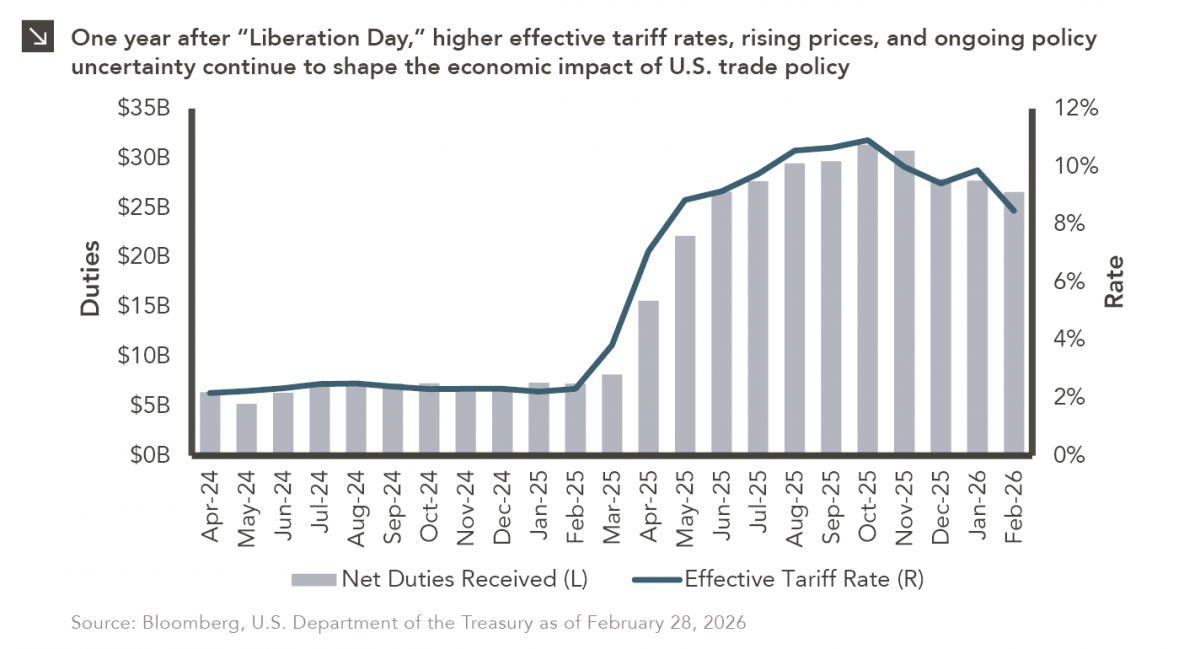
On April 2, 2025, President Donald Trump announced a sweeping set of tariffs on imports into the United States. Dubbed “Liberation Day,” the announcement marked one of the most significant shifts in U.S. trade policy in decades and initiated a period of heightened uncertainty across global supply chains and financial markets. One year later, it is useful to examine how markets and economic participants have navigated the resulting trade environment.
A key distinction when assessing the impact of tariffs is the difference between the policy tariff rate and the effective tariff rate (ETR). While the headline policy rate often attracts the most attention, the ETR provides a more accurate measure of economic impact. The ETR reflects the ratio of duties actually collected relative to the total value of imports entering the country. Because it incorporates supply-chain adjustments, exemptions, and technical exclusions, the effective rate tends to have a closer relationship with market outcomes than the stated policy rate.
Following Liberation Day, the monthly ETR rose sharply (from roughly 3% in March 2025 to approximately 7% in April 2025) before continuing higher and reaching a peak near 10.9% in October. By the end of February 2026, the rate had moderated but remained elevated at slightly above 8%. Over that period, the U.S. Treasury reported that the government collected approximately $295 billion in net customs duties. The administration highlighted a decline in the U.S. trade deficit of roughly 24% during the same time frame.
Another important concept is the tariff pass-through rate, which measures the extent to which higher tariffs translate into higher prices paid by businesses and consumers. Although tariff costs are shared across the global supply chain, they are not distributed evenly. Research from the Federal Reserve Bank of New York suggests that the majority of the tariff burden has fallen on U.S. importers, with estimates indicating that more than 85% of the incidence was borne domestically. Similar findings have been reported by the European Central Bank, which estimated that the pass-through to U.S. consumer prices reached roughly one-third in 2025 and could rise further if elevated tariff levels persist.
Federal Reserve officials have also acknowledged the inflationary implications of tariffs. During the FOMC press conference last month, Chair Jerome Powell noted that tariffs associated with Liberation Day had contributed to modestly higher inflation and that the full price effects could take additional time to materialize.
The policy landscape has continued to evolve. In February 2026, the U.S. Supreme Court ruled that the broad Liberation Day tariffs exceeded the administration’s authority under emergency powers, forcing the rollback of some measures and raising questions about potential tariff refunds. Nevertheless, the administration has since explored alternative legal pathways to maintain certain tariffs, underscoring that trade policy remains fluid.
As the economic effects of the original tariffs continue to unfold and as new trade measures are considered, global markets remain attentive to the evolving policy environment. One year after Liberation Day, tariffs continue to serve as a reminder that shifts in trade policy can carry meaningful economic consequences for businesses, consumers, and investors alike.
Print PDF
The opinions expressed herein are those of Marquette Associates, Inc. (“Marquette”), and are subject to change without notice. This material is not financial advice or an offer to purchase or sell any product. Marquette reserves the right to modify its current investment strategies and techniques based on changing market dynamics or client needs.

07.24.2026
This video is a recording of a live webinar held July 23 by Marquette’s research team analyzing the first half…
07.22.2026
The usual midyear version of these letters has touched on year-to-date performance as well as the most influential macroeconomic and…

07.20.2026
Our most recent Chart of the Week publication discussed how the AI investment opportunity has expanded beyond…

07.13.2026
One of the enduring lessons of the California Gold Rush is that the greatest fortunes were often made not by…

07.06.2026
Since traditional exit routes have remained constrained in recent years due to higher interest rates, valuation gaps, and a subdued…

06.29.2026
This week’s chart highlights the varying return profiles across key infrastructure sectors by illustrating the split between income and capital…
Research alerts keep you updated on our latest research publications. Simply enter your contact information, choose the research alerts you would like to receive and click Subscribe. Alerts will be sent as research is published.
We respect your privacy. We will never share or sell your information.
If you have questions or need further information, please contact us directly and we will respond to your inquiry within 24 hours.
Contact Us >