Weston Whalen, CFA
Associate Research Analyst
Get to Know Weston


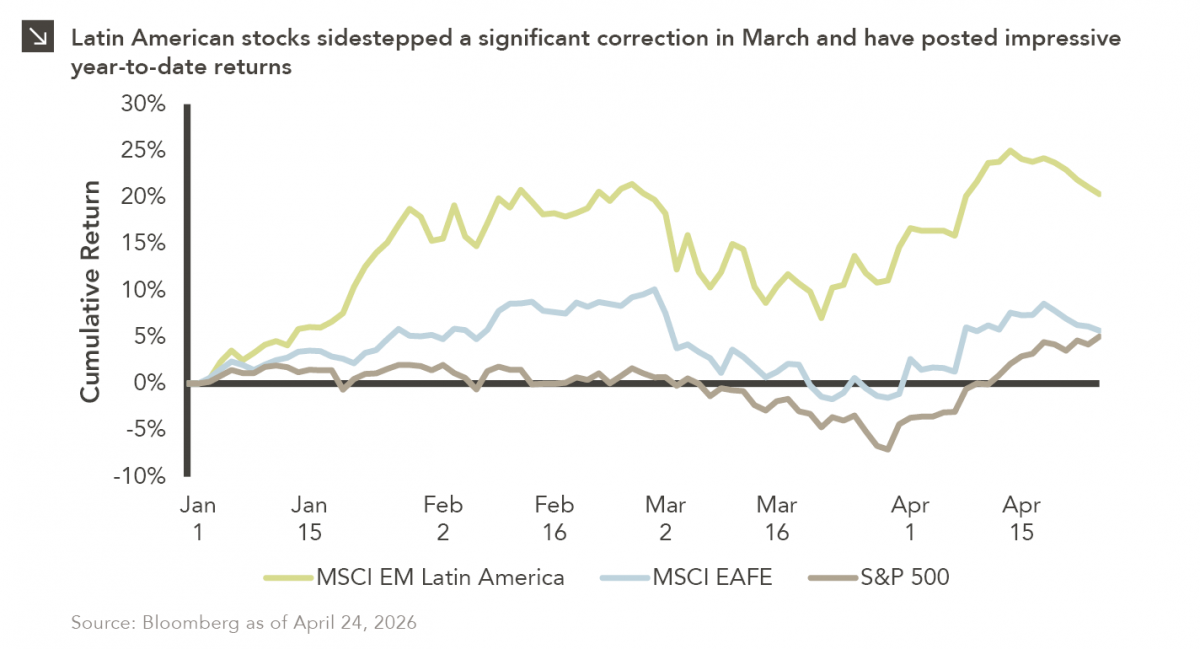
Latin American equity markets have shown remarkable strength in 2026. After a strong start to the year, the MSCI Emerging Markets Latin America Index corrected by only 4% in March amid a broad, more pronounced market pullback due in large part to the conflict in Iran. Brazil, which represents the largest economy in Latin America, was uniquely positioned to handle commodity market disruptions given its status as a net exporter of crude oil and a world leader in renewable energy utilization. Indeed, almost 90% of Brazilian electricity is generated via hydropower, wind, and solar sources, so the nation has been able to withstand recent energy shocks better than many other Western nations. The Central Bank of Brazil also cut interest rates for the first time in two years in March, though additional rate cuts that were anticipated at the start of this year are now more uncertain. Investors have also looked on Latin American financial institutions with favor in recent time, as banks across the region (e.g., Creditcorp in Peru, Itaú in Brazil, and Grupo Financiero Banorte in Mexico) are outperforming their global peers on a year-to-date basis due to attractive earnings projections. Additionally, significant foreign investment in the Brazilian economy has led to higher volumes and earnings for B3, the Brazilian stock exchange.
Global markets have stabilized in April, with the S&P 500 Index now trading near calendar year highs and developed international equities also exhibiting renewed strength. At the same time, Latin American equities have continued their upward trajectory, with the MSCI Emerging Markets Latin America Index now up more than 20% since the start of 2026. Following strong performance in 2025 and after having avoided a major drawdown in the wake of the Iran conflict, investors may want to keep a close eye on Latin American stocks as the year progresses.
Print PDF
The opinions expressed herein are those of Marquette Associates, Inc. (“Marquette”), and are subject to change without notice. This material is not financial advice or an offer to purchase or sell any product. Marquette reserves the right to modify its current investment strategies and techniques based on changing market dynamics or client needs.

10.12.2026
This week’s chart highlights the accelerating growth of electricity demand in the U.S., which has been driven primarily by the…

10.08.2026
LIVE WEBINAR — OCTOBER 22 Please join Marquette’s research team for our 3Q 2026 Market Insights Webinar…

10.05.2026
For investors, the spookiest thing about October might not be the ghosts and monsters that are bound to show up…

09.28.2026
The phrase “expectations of higher inflation” has become a staple in financial news to explain the increase in nominal U.S….

09.21.2026
For much of the past several years, the conventional view has been that higher interest rates and stretched valuations would…

09.14.2026
There are many great things about working at Marquette Associates, but “Free Lunch Tuesday” is right at the top of…
Research alerts keep you updated on our latest research publications. Simply enter your contact information, choose the research alerts you would like to receive and click Subscribe. Alerts will be sent as research is published.
We respect your privacy. We will never share or sell your information.
If you have questions or need further information, please contact us directly and we will respond to your inquiry within 24 hours.
Contact Us >