Mike Spychalski, CAIA
Vice President


This week’s Chart of the Week shows the impact of government transfer payments (Social Security, Medicare/Medicaid, unemployment insurance, veterans benefits, food stamps, training & education programs, etc.) on disposable income (defined as personal income minus personal income taxes) in the U.S. over the past several years.
As the chart illustrates, since the recession began in December of 2007, real disposable personal income in the U.S. has increased from $9,974.7 billion to $10,354.8 billion (an increase of 3.8%). However, when excluding government transfer payments, real disposable income has decreased from $8,203.4 billion to $7,979.3 billion (a decrease of 2.7%). There are several reasons for the discrepancy between discretionary income and discretionary income excluding transfer payments, but the two primary reasons are: the U.S. economy has approximately 3.5 million fewer jobs now than in December 2007, and the population of the U.S. is aging. The loss of 3.5 million jobs results in both a drag on income (fewer people working results in lower incomes) and a boost in government transfer payments (fewer people working results in increased payments for unemployment insurance, food stamps, Medicaid, and job training programs.). The aging population of the country drives a boost in spending on programs such as Social Security and Medicare.
Over the past 30 years, government transfer payments have represented 13.9% of total personal income in the U.S. From January 2008 to July 2012, government transfer payments have represented 17.4% of total personal income in the country. Given the persistently high unemployment rate, the current budget deficit, the looming fiscal cliff, and the potential for cuts to government transfer payments in the near term, it is important to understand where the growth in government transfers has come from. The table below shows the current breakdown of government transfers by category as well as the average from January 2008 to present and the 30 year average.
Breakdown of Government Transfers
|
Social Security |
Medicare/ |
Unemployment |
Veterans’ |
Other* |
|
| Current |
32.7% |
42.0% |
3.4% |
3.2% |
18.8% |
| Jan 08-Present |
31.8% |
41.7% |
4.9% |
2.6% |
19.0% |
| 30 Year Avg. |
36.2% |
39.3% |
3.6% |
2.7% |
18.2% |
* Other includes programs such as welfare payments, food stamps, earned income tax credits, job training, and disaster relief.
As the table shows, part of the increase in government transfers are cyclical in nature and come from programs such as unemployment insurance, food stamps, and job training. These programs have begun to shrink and should continue to shrink as the economy improves. However, the aging population of the country will have a significant impact on the largest components of government transfers, Social Security and Medicare. These problems are structural in nature, and as the population continues to age, spending on these programs should continue to increase. This means that unless there are significant cuts to Social Security and Medicare, it is likely that government transfer payments will remain at this elevated level well into the future.

The opinions expressed herein are those of Marquette Associates, Inc. (“Marquette”), and are subject to change without notice. This material is not financial advice or an offer to purchase or sell any product. Marquette reserves the right to modify its current investment strategies and techniques based on changing market dynamics or client needs.

08.31.2026
Private equity has always had a few portfolio companies that refused to leave the party. Today, however, the industry appears…

08.24.2026
The global bond market is facing renewed pressure as investors demand higher yields to hold long-dated government debt, pushing borrowing…

08.17.2026
As a college football player struggling to put on mass, the “supersizing” deal at McDonald’s was hard to beat. For…

08.10.2026
After reaching nearly ¥164 per dollar, its weakest level in roughly four decades, the yen had become a source of…

08.03.2026
In the cinematic masterpiece Rocky IV, Rocky gets dazed by his opponent, Captain Ivan Drago, and complains that he sees…
07.27.2026
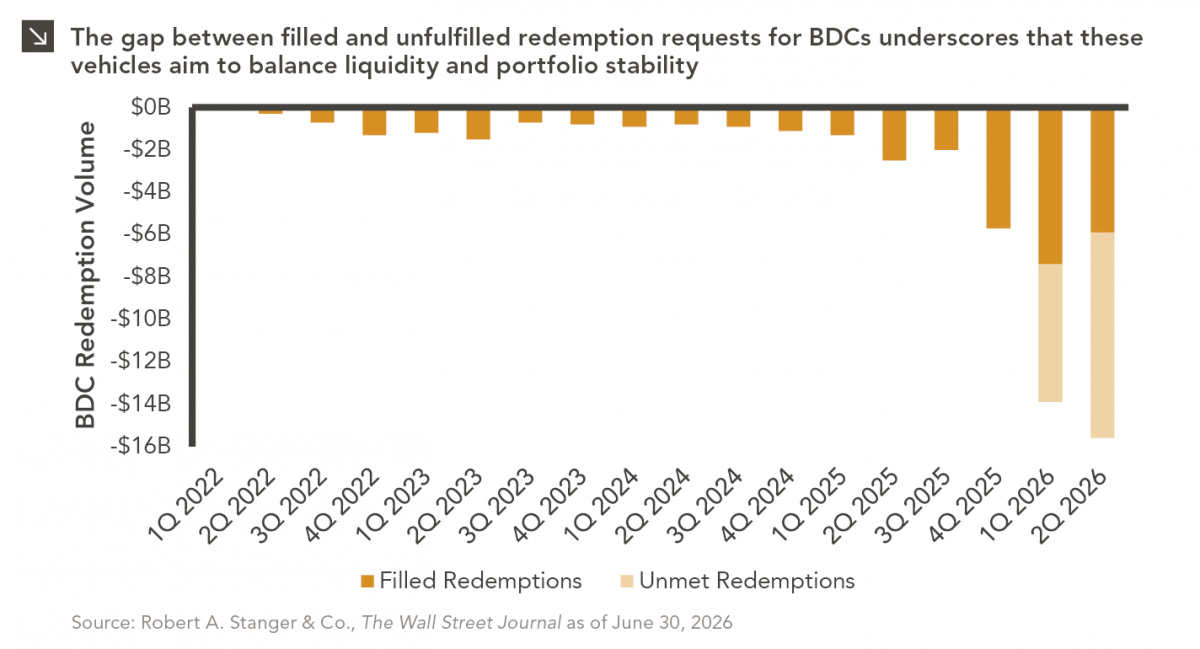
The rapid growth of non-traded business development companies (BDCs), which are investment vehicles that pool investor capital to make loans…
Research alerts keep you updated on our latest research publications. Simply enter your contact information, choose the research alerts you would like to receive and click Subscribe. Alerts will be sent as research is published.
We respect your privacy. We will never share or sell your information.
If you have questions or need further information, please contact us directly and we will respond to your inquiry within 24 hours.
Contact Us >