Marquette Associates
Menu ☰
Close ✕
  • Login
    • Reporting Login
    • Research Login
    • Manager Login
    • Private Client Login
  • People
  • Expertise
    • Corporate
    • Endowments & Foundations
    • Healthcare
    • Private Clients
    • Public Funds
    • Religious
    • Sustainable Investing
    • Taft-Hartley
  • Services
    • Investment Consulting
    • Defined Contribution Consulting
    • Outsourced CIO
    • Private Client Consulting
  • Research
  • About
    • Careers
  • Contact
  • Search
Close

CHIPS Ahoy!

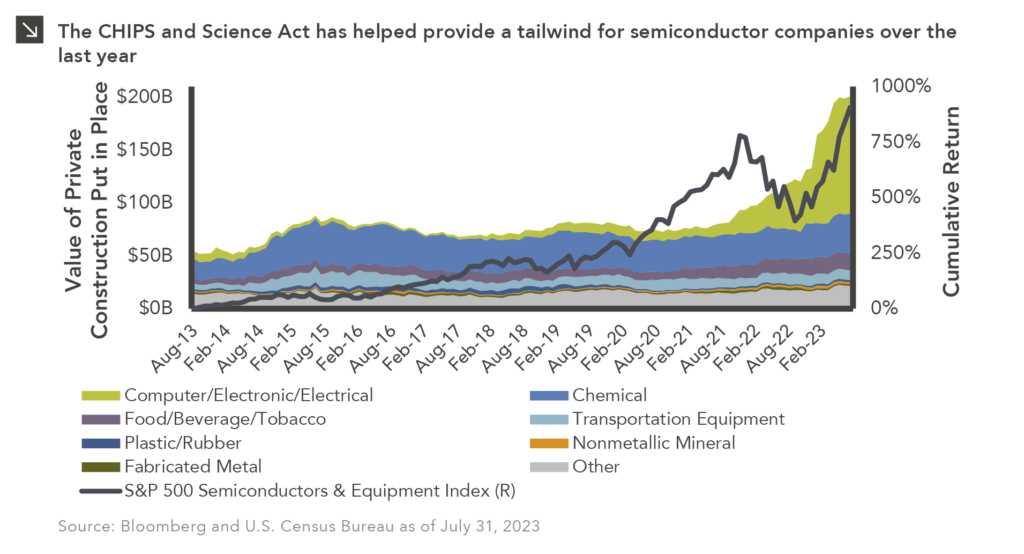
This chart description is for illustrative purposes only and its accuracy cannot be guaranteed. Please see full disclosures at end of PDF document in the web post. General description: Combination line and area chart showing cumulative return of the S&P 500 Semiconductors & Equipment Index and value of private construction put in place by sector. Chart subtitle: The CHIPS and Science Act has helped provide a tailwind for semiconductor companies over the last year. Chart source: Bloomberg and U.S. Census Bureau as of July 31, 2023. Chart visual description: Data is monthly; displayed in 6-month increments on x-axis from Aug-13 to present. Left Y-axis is labeled “Value of Private Construction Put in Place” and ranges from $0B to $210B (labeled through $200B). Right Y-axis is labeled “Cumulative Return” and ranges from 0% to 1000%. Sectors corresponding to left axis are as follows: Computer/Electronic/Electrical uppermost of area stack in green; Chemical in blue; Food/Beverage/Tobacco in purple; Transportation Equipment in teal; Plastic/Rubber in dark blue; Nonmetallic Mineral in orange; Fabricated Metal in dark green; Other in gray. Line corresponding to S&P 500 Semiconductors & Equipment Index is slate, corresponding to right Y-axis. Chart data description: Please contact us for the full dataset. Latest data as of July 2023: S&P 500 Semiconductors & Equipment Index at 907% cumulative return; CEE at $110.9B; Chemical at $37.8B; Food/Bev/Tobacco at $15.9B; Transp Equipment at $9.1B; Plastic/Rubber at $2.2B; Nonmetallic Mineral at $1.9B; Fabricated Metal at 1$.4B; Other at $21.5B. End chart description. See disclosures at end of document.
Posted on September 6, 2023September 6, 2023 Full size 1911 × 1033

Post navigation

Published inCHIPS Ahoy!

Subscribe to Research Email Alerts

Subscribe

Research Email Alert Subscription

Research alerts keep you updated on our latest research publications. Simply enter your contact information, choose the research alerts you would like to receive and click Subscribe. Alerts will be sent as research is published.

We respect your privacy. We will never share or sell your information.

Thank You

We appreciate your interest in Marquette Associates.

If you have questions or need further information, please contact us directly and we will respond to your inquiry within 24 hours.

Contact Us >

© 2026 Marquette Associates. All Rights Reserved.

  • Terms of Use
  • Form CRS, ADV, Privacy Policy & Disclosures
  • Environmental Policy

Chicago
180 North LaSalle Street
Suite 3500
Chicago, Illinois 60601
Tel: 312.527.5500
Fax: 312.527.9064

Baltimore
225 Schilling Circle
Suite 260
Hunt Valley, MD 21031
Tel: 410.825.0444
Fax: 410.825.1777

Milwaukee
731 N. Water Street
Suite 790
Milwaukee, WI 53202
Tel: 414.209.3290

Philadelphia
600 Willowbrook Lane
Suite 610
West Chester, PA 19382
Tel: 610.719.0300
Fax: 610.719.8345

St. Louis
12444 Powerscourt Drive
Suite 190
St. Louis, MO 63131
Tel: 314.822.4444
Fax: 314.822.4401