Eddie Arrieta
Associate Research Analyst
Get to Know Eddie


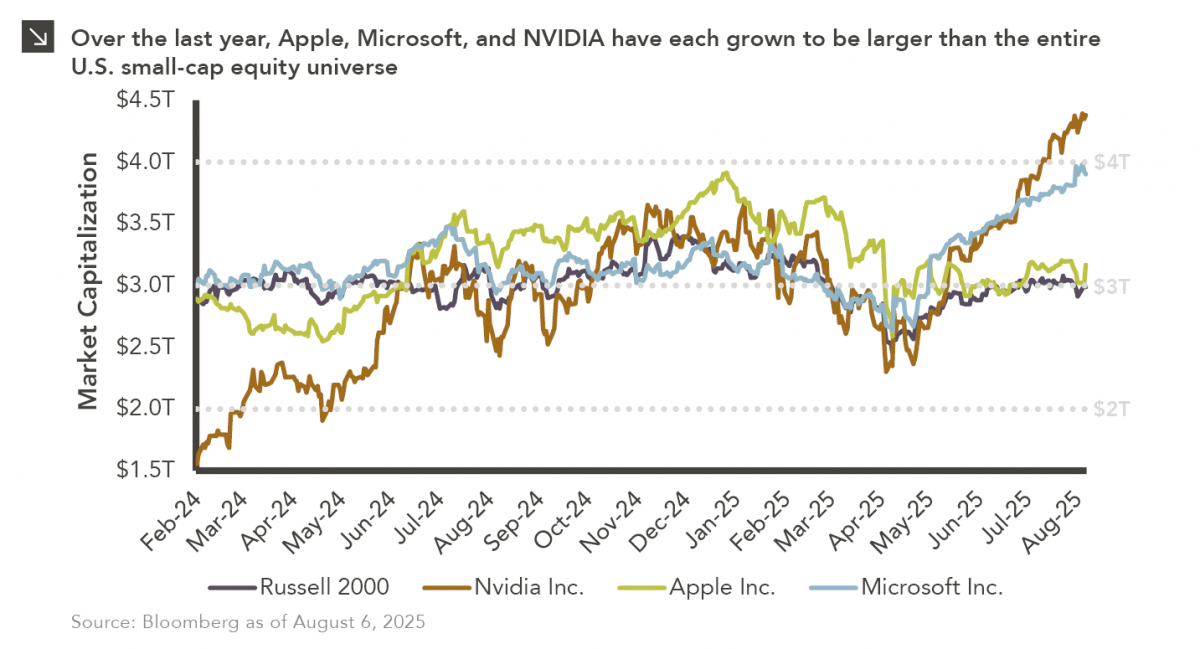
In last year’s “2 vs. 2000” Chart of the Week publication, we explored the emergence of trillion-dollar companies, noting that Microsoft and Apple had each exceeded the combined market capitalization of Russell 2000 Index constituents. Since then, another technology giant has crossed that threshold, with NVIDIA recently becoming the first company to reach a market capitalization of $4 trillion. While Microsoft currently hovers around this level thanks to robust earnings and demand for its cloud and enterprise solutions, Apple has experienced more turmoil in recent time. In the first three months of this year, Apple shed nearly $1.5 trillion from its market capitalization amid trade tensions and concerns about slowing growth. During this bout of volatility, the company briefly became smaller than the U.S. small-cap equity universe, but a rally sparked by its announcement to bring manufacturing back to the U.S. helped Apple regain its footing and once again surpass the Russell 2000 Index in terms of market capitalization.
The meteoric rise of Apple, Microsoft, and NVIDIA underscores ongoing investor preferences for large-cap, technology-focused companies. In contrast, the U.S. small-cap space, which is more tilted toward businesses in sectors like Financials and Industrials, has struggled in recent years for this same reason. The Russell 2000 Index has also been negatively impacted by the realization of smaller company growth within private markets, as outlined in a recent newsletter. Going forward, investors should be cognizant of the risks posed by both large and small companies and remain adequately diversified across the market capitalization spectrum.
Print PDF
The opinions expressed herein are those of Marquette Associates, Inc. (“Marquette”), and are subject to change without notice. This material is not financial advice or an offer to purchase or sell any product. Marquette reserves the right to modify its current investment strategies and techniques based on changing market dynamics or client needs.

10.12.2026
This week’s chart highlights the accelerating growth of electricity demand in the U.S., which has been driven primarily by the…

10.08.2026
LIVE WEBINAR — OCTOBER 22 Please join Marquette’s research team for our 3Q 2026 Market Insights Webinar…

10.05.2026
For investors, the spookiest thing about October might not be the ghosts and monsters that are bound to show up…

09.28.2026
The phrase “expectations of higher inflation” has become a staple in financial news to explain the increase in nominal U.S….

09.21.2026
For much of the past several years, the conventional view has been that higher interest rates and stretched valuations would…

09.14.2026
There are many great things about working at Marquette Associates, but “Free Lunch Tuesday” is right at the top of…
Research alerts keep you updated on our latest research publications. Simply enter your contact information, choose the research alerts you would like to receive and click Subscribe. Alerts will be sent as research is published.
We respect your privacy. We will never share or sell your information.
If you have questions or need further information, please contact us directly and we will respond to your inquiry within 24 hours.
Contact Us >