Chad Sheaffer, CFA, CAIA
Senior Research Analyst


Higher interest rates have broadly impacted capital markets, including M&A deal flow given the significant increase in financing costs. Along with that, elevated regulatory risk has been another headwind for the space.
Since her appointment as Chair of the Federal Trade Commission (FTC) in June 2021, Lina Khan has emerged as one of the most aggressive anti-trust leaders the U.S. and Wall Street have seen in some time. For large corporations seeking growth via M&A, the regulatory requirements for FTC approval have increased significantly. Deals that would likely have been approved with ease in prior administrations now face costly lawsuits, injunctions, and other challenges by the Commission. Coupled with higher financing costs, the FTC’s aggressive agenda has significantly prolonged the timeline for deals to close. In the second quarter of 2023, completed M&A deal volumes came in at mere $95 billion, just above the $83 billion of deals closed at the height of COVID in the second quarter 2022. At the same time, the volume of pending deals awaiting regulatory approval has substantially increased, reaching $183 billion in the second quarter.
The FTC’s actions have had a clear impact on the M&A environment, leading to significantly wider deal spreads in 2023 amid increased uncertainty. This is both an opportunity and a risk for hedge funds specializing in merger arbitrage. While deal spreads appear attractive, they come with heightened risks that require expertise to successfully navigate. For investors, selecting experienced managers with a proven track record of success across different regulatory regimes is critical to achieving favorable risk-adjusted returns.
The opinions expressed herein are those of Marquette Associates, Inc. (“Marquette”), and are subject to change without notice. This material is not financial advice or an offer to purchase or sell any product. Marquette reserves the right to modify its current investment strategies and techniques based on changing market dynamics or client needs.
11.10.2025
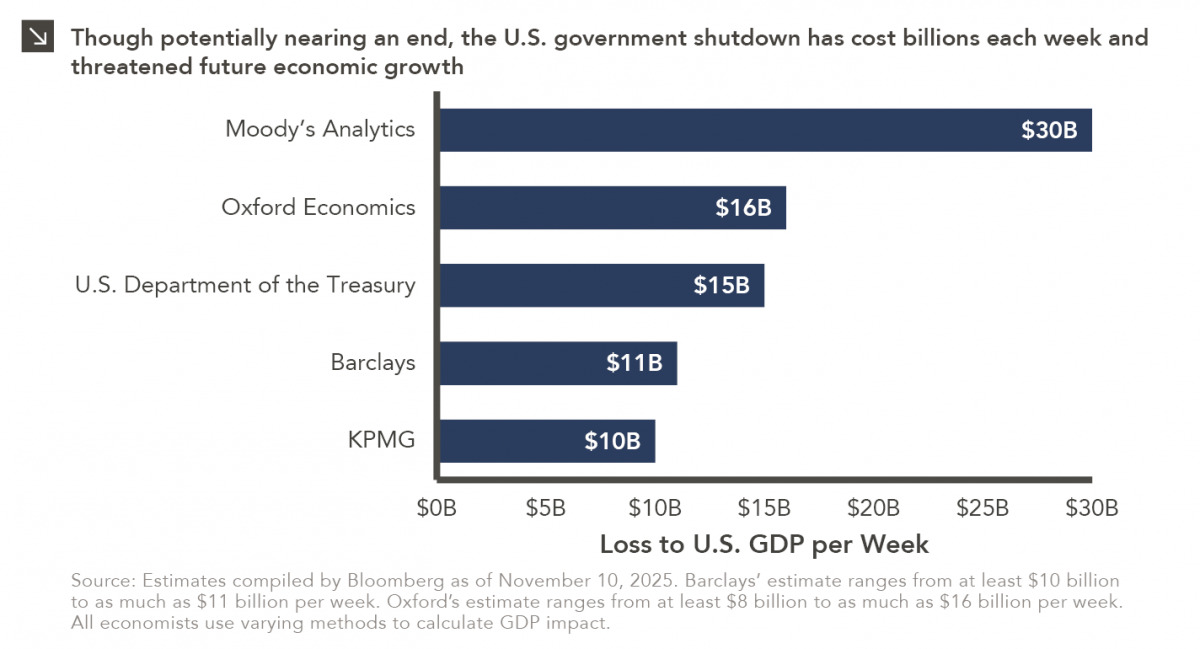
Over the weekend, the Senate overcame a key procedural obstacle in its attempt to end the record-breaking government shutdown, as…
11.03.2025
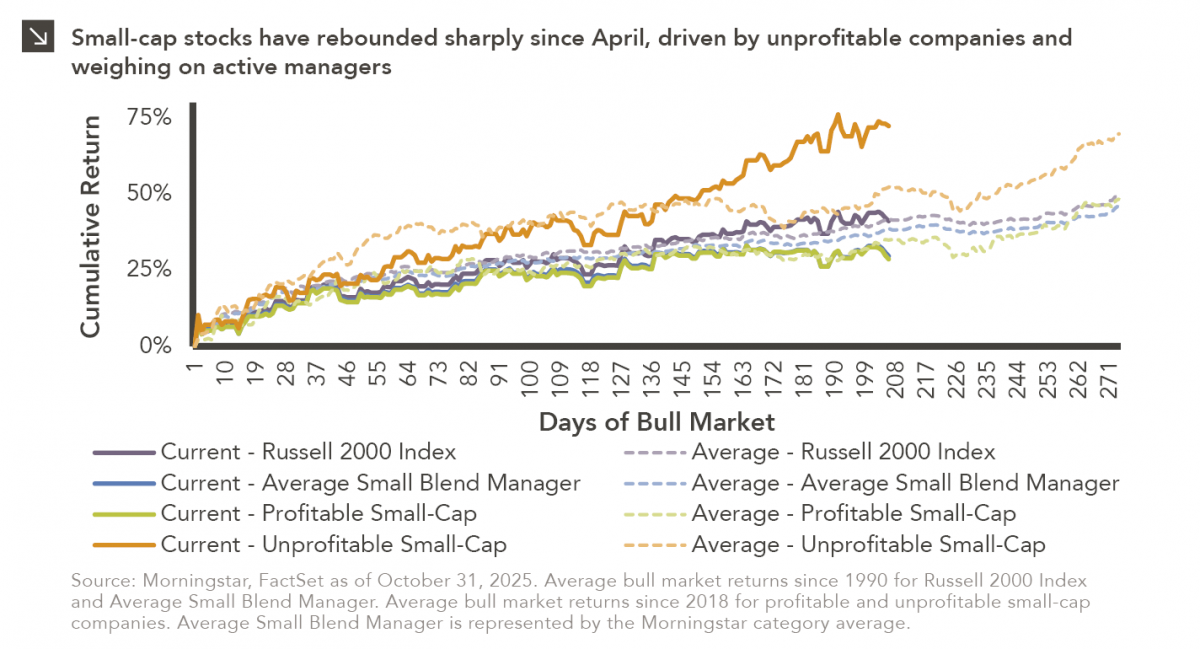
Small-cap equities are in a prolonged period of underperformance relative to large-cap stocks, but this trend has shown early signs…
10.27.2025
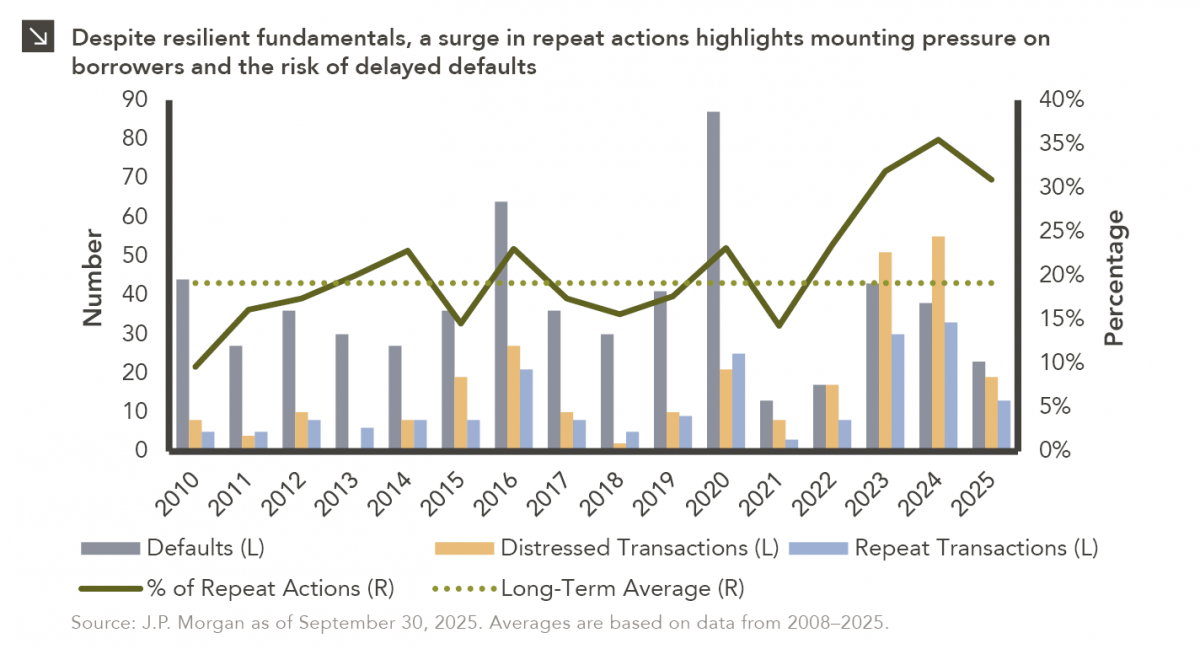
To paraphrase a quote from former President George W. Bush: “Fool me once, shame on… shame on you. Fool me…

10.22.2025
This video is a recording of a live webinar held October 22 by Marquette’s research team analyzing the third quarter…
10.22.2025
I spent the past weekend at my alma mater to watch them play their biggest rival. Football weekends there are…
10.20.2025
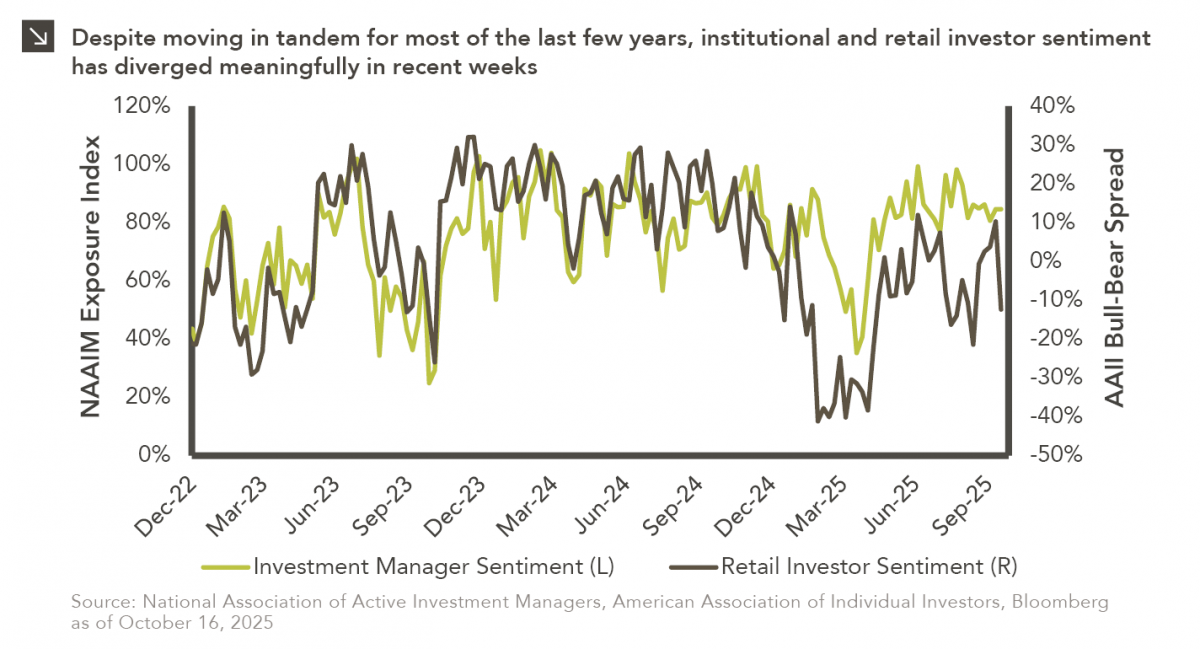
This week’s chart compares institutional and retail investor sentiment using two established indicators. Institutional sentiment is represented by the National…
Research alerts keep you updated on our latest research publications. Simply enter your contact information, choose the research alerts you would like to receive and click Subscribe. Alerts will be sent as research is published.
We respect your privacy. We will never share or sell your information.
If you have questions or need further information, please contact us directly and we will respond to your inquiry within 24 hours.
Contact Us >